| __timestamp | Intuit Inc. | The Trade Desk, Inc. |
|---|---|---|
| Wednesday, January 1, 2014 | 4506000000 | 44548000 |
| Thursday, January 1, 2015 | 4192000000 | 113836000 |
| Friday, January 1, 2016 | 4694000000 | 202926000 |
| Sunday, January 1, 2017 | 5177000000 | 308217000 |
| Monday, January 1, 2018 | 5964000000 | 477294000 |
| Tuesday, January 1, 2019 | 6784000000 | 661058000 |
| Wednesday, January 1, 2020 | 7679000000 | 836033000 |
| Friday, January 1, 2021 | 9633000000 | 1196467000 |
| Saturday, January 1, 2022 | 12726000000 | 1577795000 |
| Sunday, January 1, 2023 | 14368000000 | 1946120000 |
| Monday, January 1, 2024 | 16285000000 | 2444831000 |
Unveiling the hidden dimensions of data
In the dynamic world of technology and finance, Intuit Inc. and The Trade Desk, Inc. have emerged as significant players. Over the past decade, Intuit has demonstrated a robust revenue growth, increasing by approximately 260% from 2014 to 2023. This growth reflects Intuit's strategic innovations and market adaptability. Meanwhile, The Trade Desk, Inc. has shown an impressive revenue surge of over 4,200% during the same period, highlighting its rapid ascent in the digital advertising space.
The data for 2024 is incomplete, indicating potential future updates.
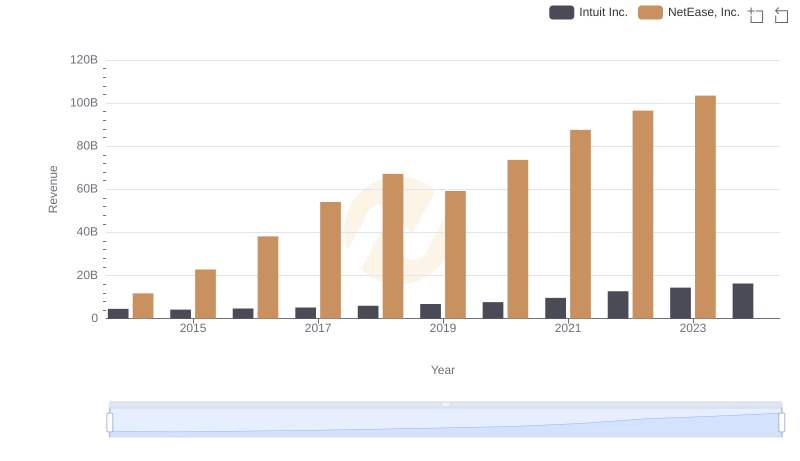
Breaking Down Revenue Trends: Intuit Inc. vs NetEase, Inc.
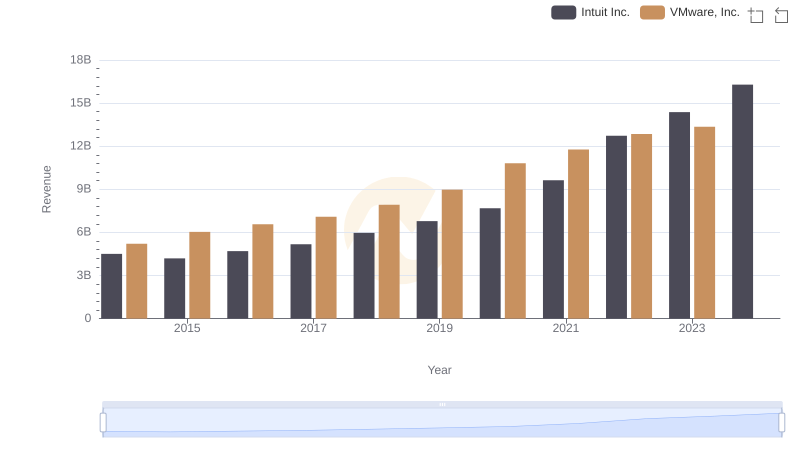
Intuit Inc. vs VMware, Inc.: Examining Key Revenue Metrics
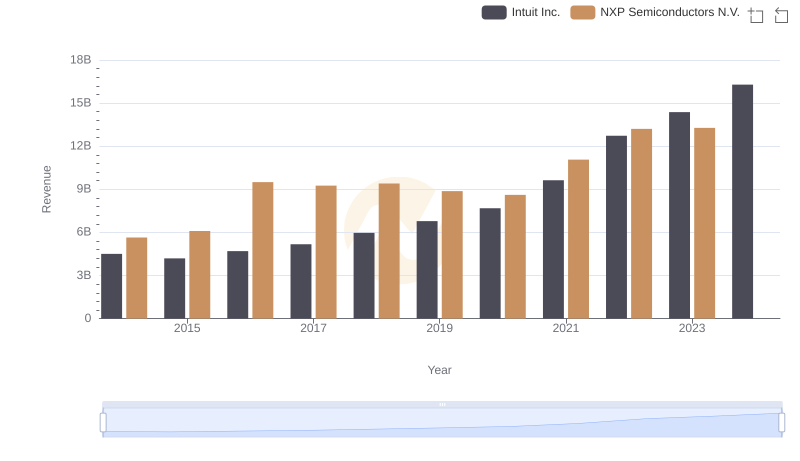
Intuit Inc. and NXP Semiconductors N.V.: A Comprehensive Revenue Analysis
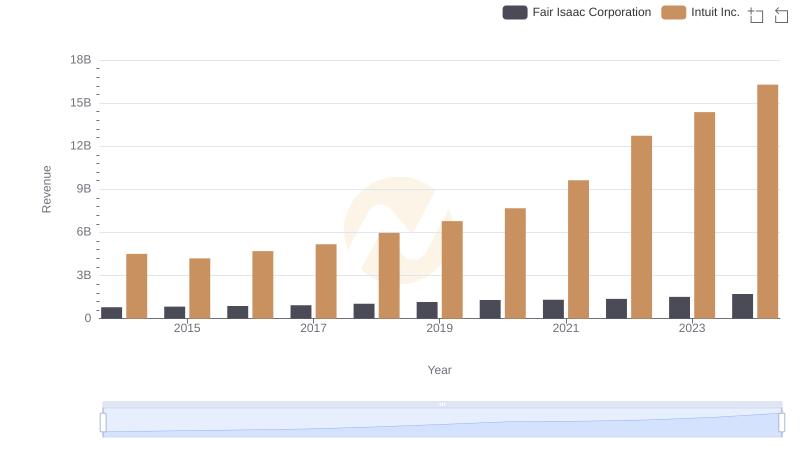
Revenue Insights: Intuit Inc. and Fair Isaac Corporation Performance Compared
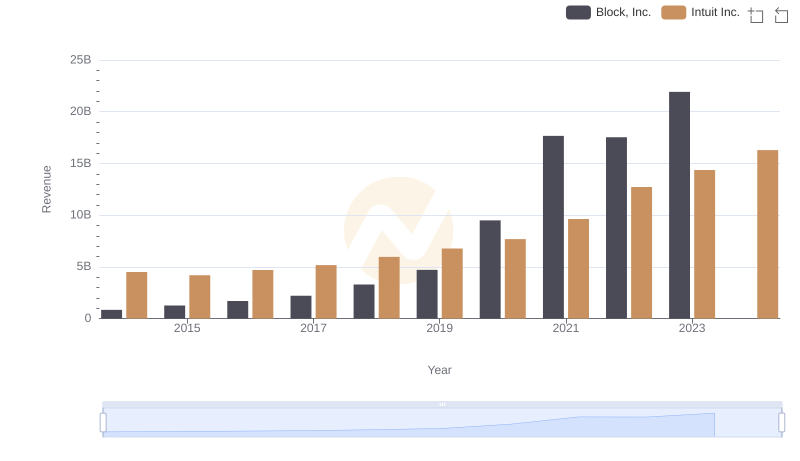
Breaking Down Revenue Trends: Intuit Inc. vs Block, Inc.
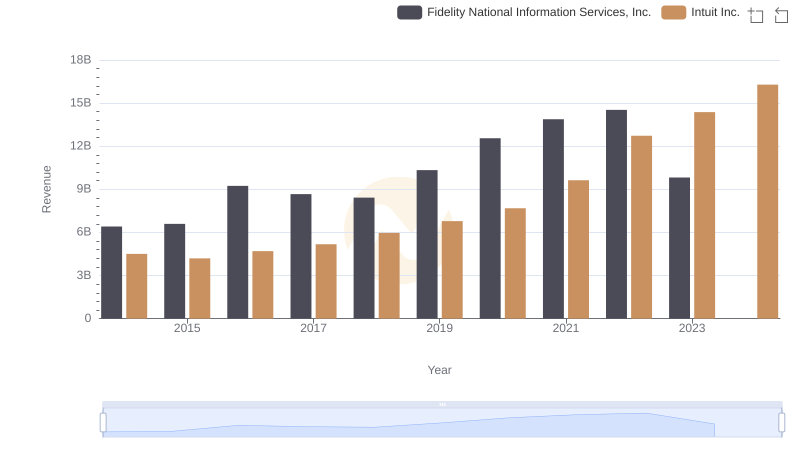
Revenue Insights: Intuit Inc. and Fidelity National Information Services, Inc. Performance Compared
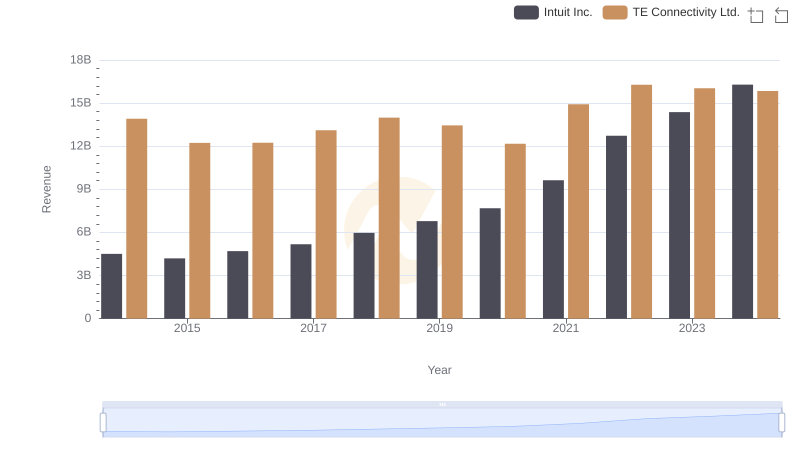
Annual Revenue Comparison: Intuit Inc. vs TE Connectivity Ltd.
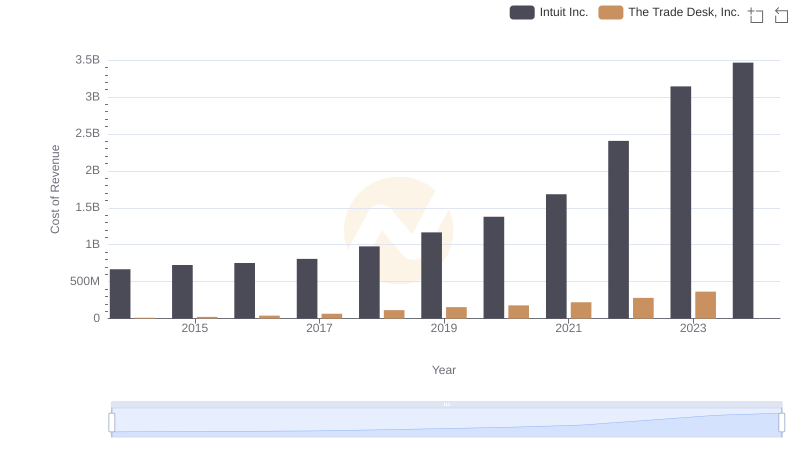
Intuit Inc. vs The Trade Desk, Inc.: Efficiency in Cost of Revenue Explored
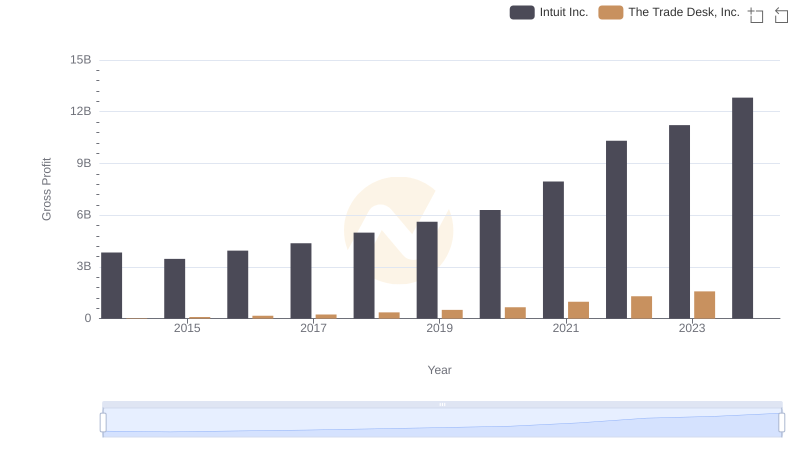
Gross Profit Comparison: Intuit Inc. and The Trade Desk, Inc. Trends
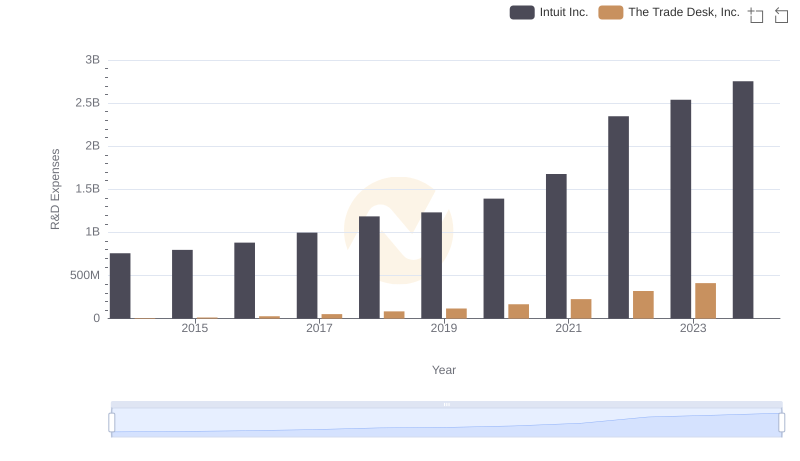
Research and Development Expenses Breakdown: Intuit Inc. vs The Trade Desk, Inc.
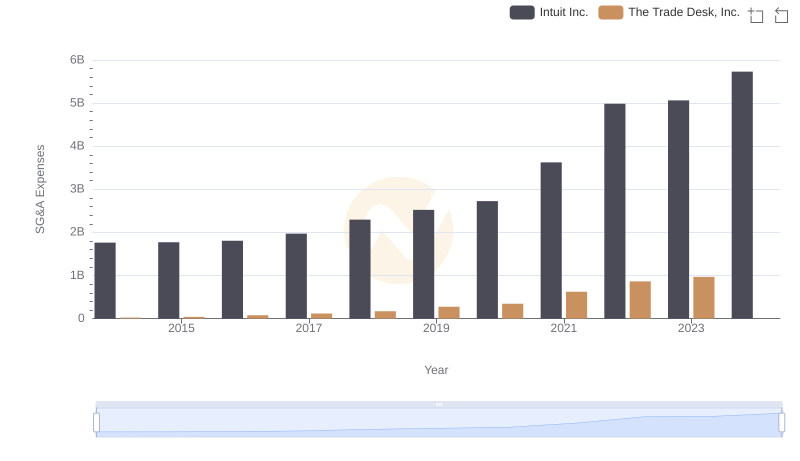
Intuit Inc. vs The Trade Desk, Inc.: SG&A Expense Trends
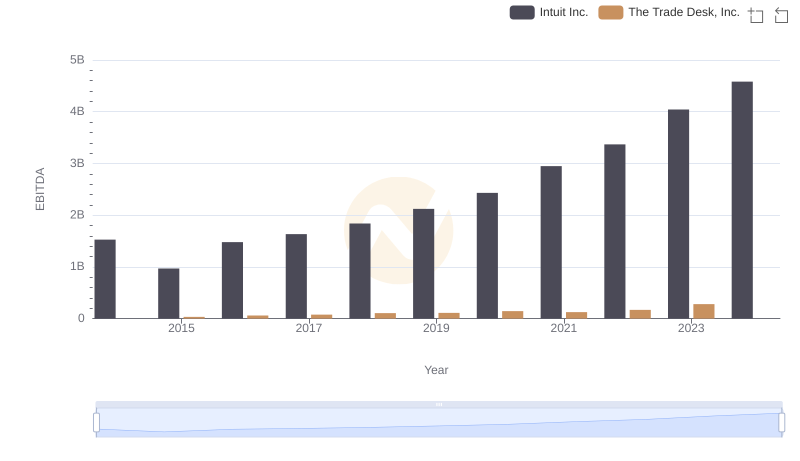
EBITDA Metrics Evaluated: Intuit Inc. vs The Trade Desk, Inc.