| __timestamp | Intuit Inc. | VMware, Inc. |
|---|---|---|
| Wednesday, January 1, 2014 | 668000000 | 730000000 |
| Thursday, January 1, 2015 | 725000000 | 917000000 |
| Friday, January 1, 2016 | 752000000 | 1018000000 |
| Sunday, January 1, 2017 | 809000000 | 1053000000 |
| Monday, January 1, 2018 | 977000000 | 1141000000 |
| Tuesday, January 1, 2019 | 1167000000 | 1258000000 |
| Wednesday, January 1, 2020 | 1378000000 | 1799000000 |
| Friday, January 1, 2021 | 1683000000 | 2043000000 |
| Saturday, January 1, 2022 | 2406000000 | 2271000000 |
| Sunday, January 1, 2023 | 3143000000 | 2482000000 |
| Monday, January 1, 2024 | 3465000000 |
Cracking the code
In the ever-evolving landscape of technology, understanding the financial health of industry giants is crucial. This analysis delves into the cost of revenue trends for Intuit Inc. and VMware, Inc. from 2014 to 2023. Over this decade, Intuit's cost of revenue surged by over 400%, reflecting its aggressive growth strategy and expanding product offerings. In contrast, VMware's cost of revenue increased by approximately 240%, indicating steady growth in its virtualization and cloud services.
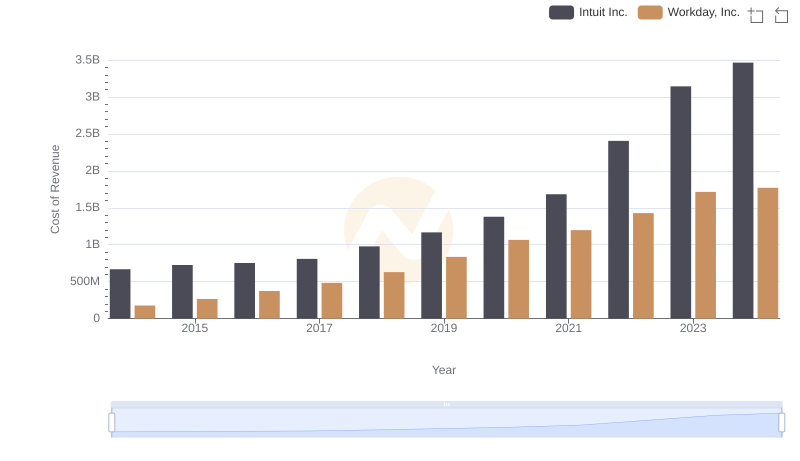
Comparing Cost of Revenue Efficiency: Intuit Inc. vs Workday, Inc.
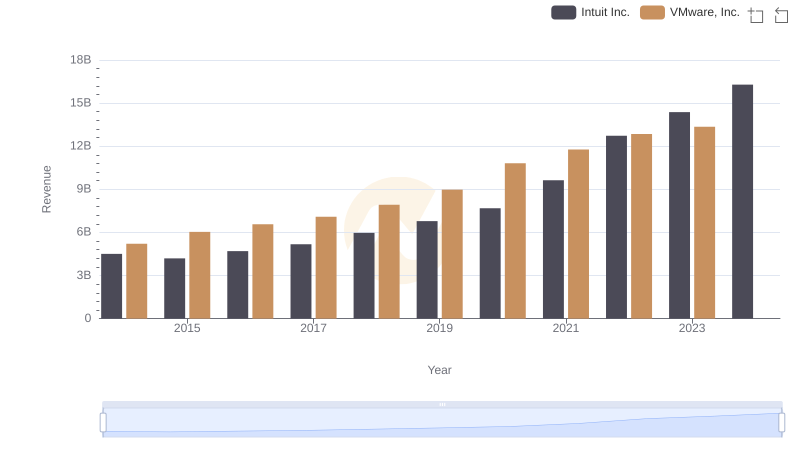
Intuit Inc. vs VMware, Inc.: Examining Key Revenue Metrics
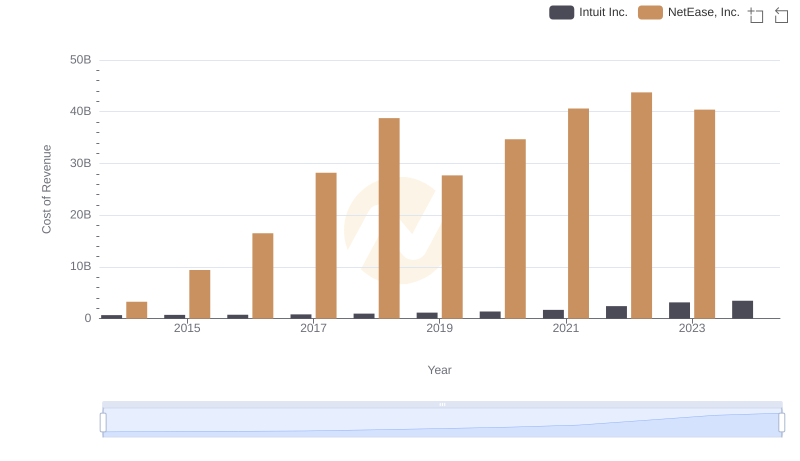
Cost of Revenue: Key Insights for Intuit Inc. and NetEase, Inc.
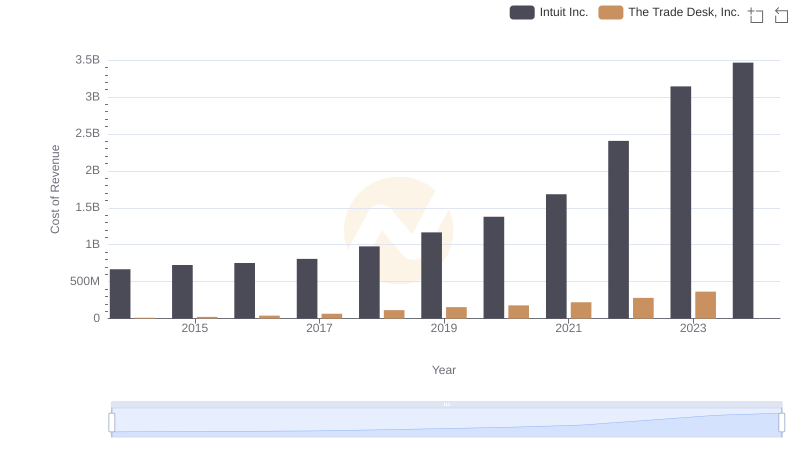
Intuit Inc. vs The Trade Desk, Inc.: Efficiency in Cost of Revenue Explored
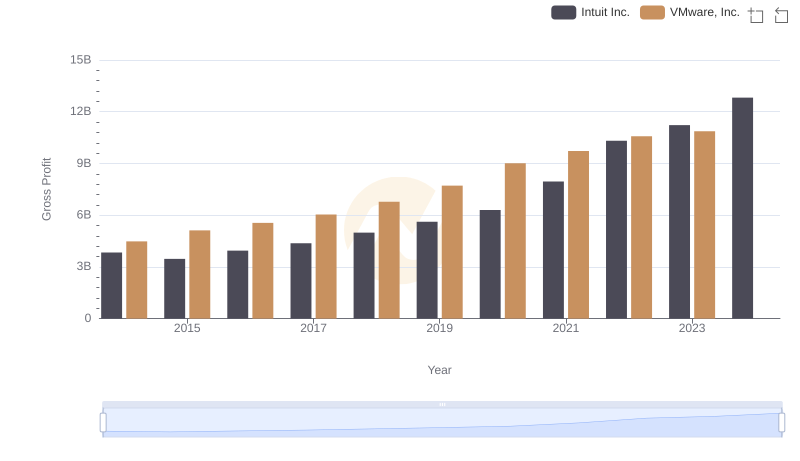
Intuit Inc. and VMware, Inc.: A Detailed Gross Profit Analysis
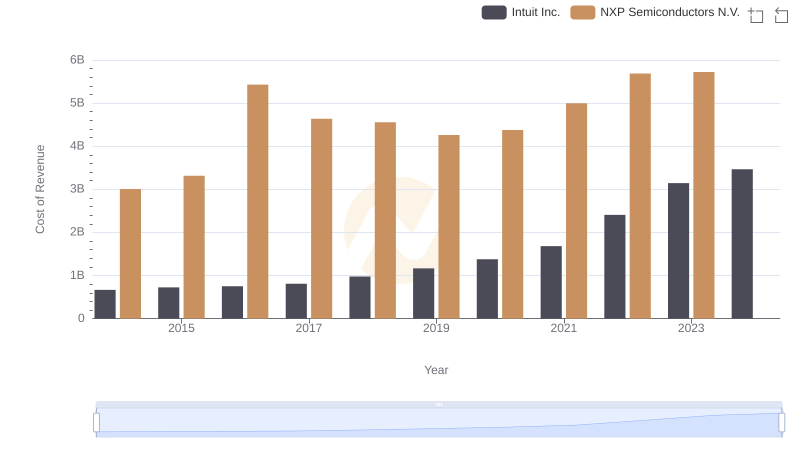
Comparing Cost of Revenue Efficiency: Intuit Inc. vs NXP Semiconductors N.V.
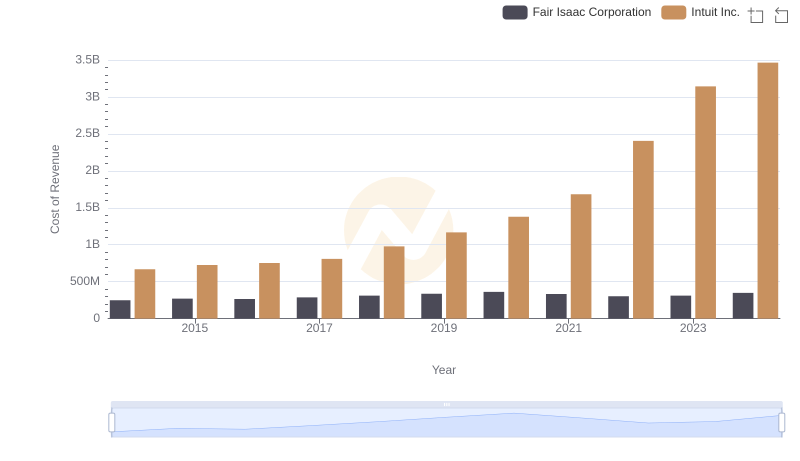
Cost of Revenue Comparison: Intuit Inc. vs Fair Isaac Corporation
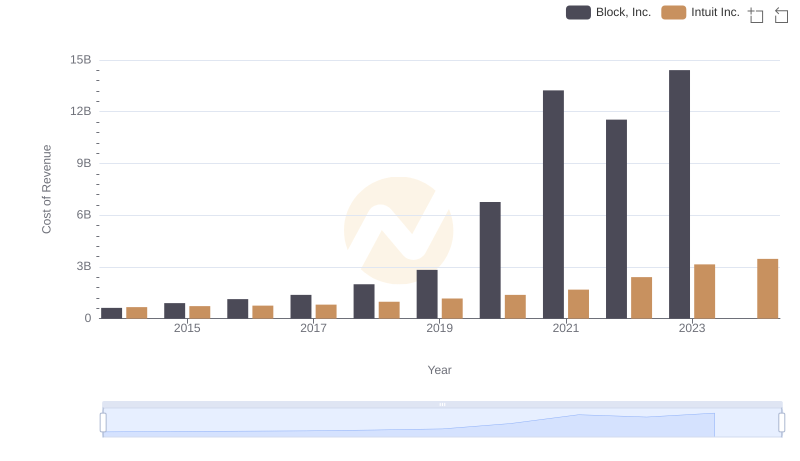
Cost Insights: Breaking Down Intuit Inc. and Block, Inc.'s Expenses
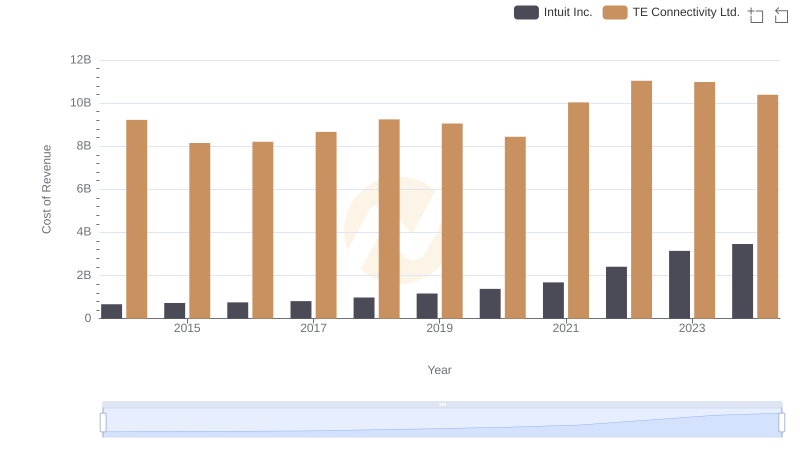
Cost of Revenue: Key Insights for Intuit Inc. and TE Connectivity Ltd.
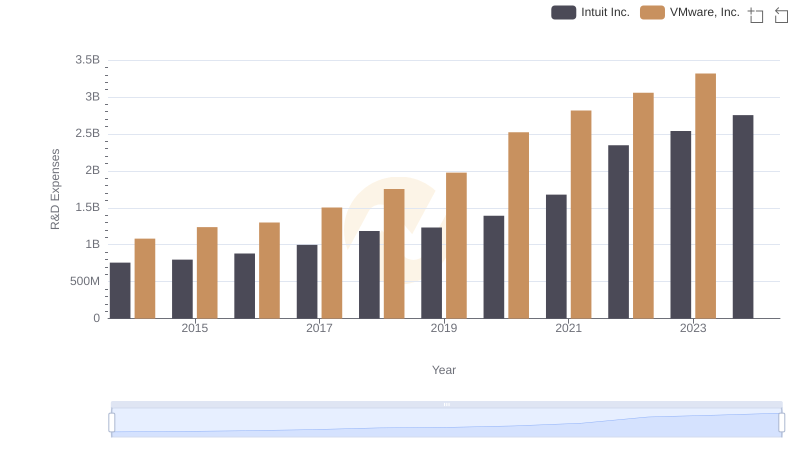
Intuit Inc. or VMware, Inc.: Who Invests More in Innovation?
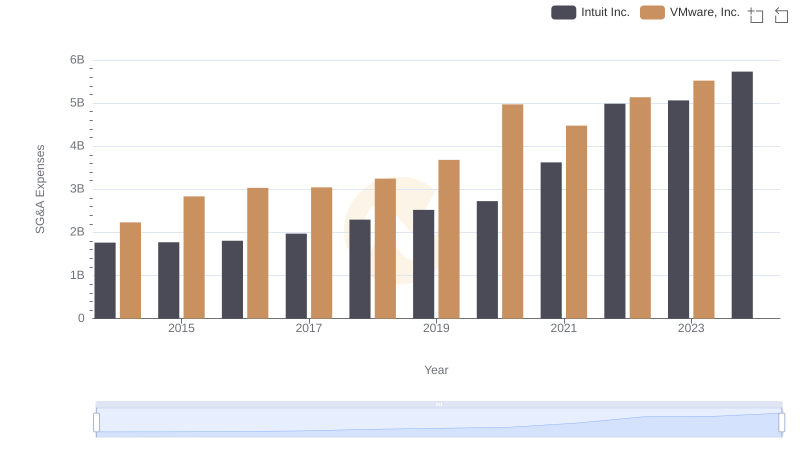
Cost Management Insights: SG&A Expenses for Intuit Inc. and VMware, Inc.
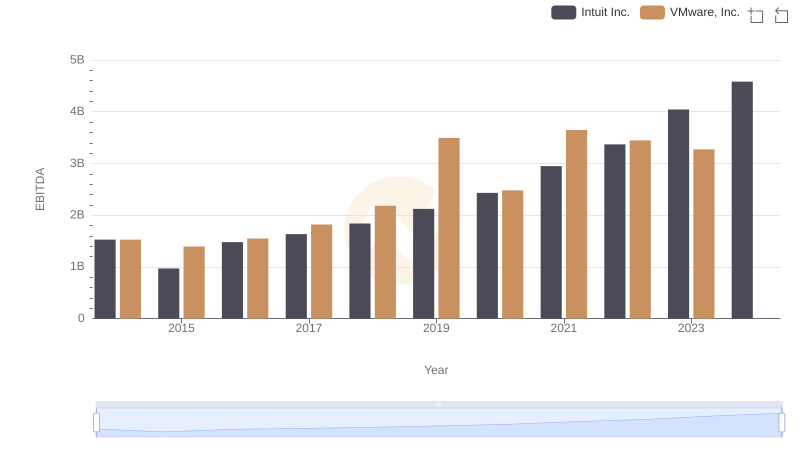
EBITDA Analysis: Evaluating Intuit Inc. Against VMware, Inc.