| __timestamp | Intuit Inc. | NXP Semiconductors N.V. |
|---|---|---|
| Wednesday, January 1, 2014 | 668000000 | 3007000000 |
| Thursday, January 1, 2015 | 725000000 | 3314000000 |
| Friday, January 1, 2016 | 752000000 | 5429000000 |
| Sunday, January 1, 2017 | 809000000 | 4637000000 |
| Monday, January 1, 2018 | 977000000 | 4556000000 |
| Tuesday, January 1, 2019 | 1167000000 | 4259000000 |
| Wednesday, January 1, 2020 | 1378000000 | 4377000000 |
| Friday, January 1, 2021 | 1683000000 | 4996000000 |
| Saturday, January 1, 2022 | 2406000000 | 5688000000 |
| Sunday, January 1, 2023 | 3143000000 | 5723000000 |
| Monday, January 1, 2024 | 3465000000 |
In pursuit of knowledge
In the ever-evolving landscape of technology and finance, understanding cost efficiency is crucial. This comparison between Intuit Inc. and NXP Semiconductors N.V. offers a fascinating glimpse into their financial strategies over the past decade. From 2014 to 2023, Intuit's cost of revenue surged by over 400%, reflecting its aggressive growth and expansion strategies. In contrast, NXP Semiconductors maintained a more stable trajectory, with a 90% increase in the same period, showcasing its focus on steady, sustainable growth.
Interestingly, while Intuit's cost of revenue peaked in 2024, NXP's data for that year remains elusive, hinting at potential strategic shifts or reporting delays. This analysis not only highlights the dynamic nature of these industry leaders but also underscores the importance of cost management in achieving long-term success.
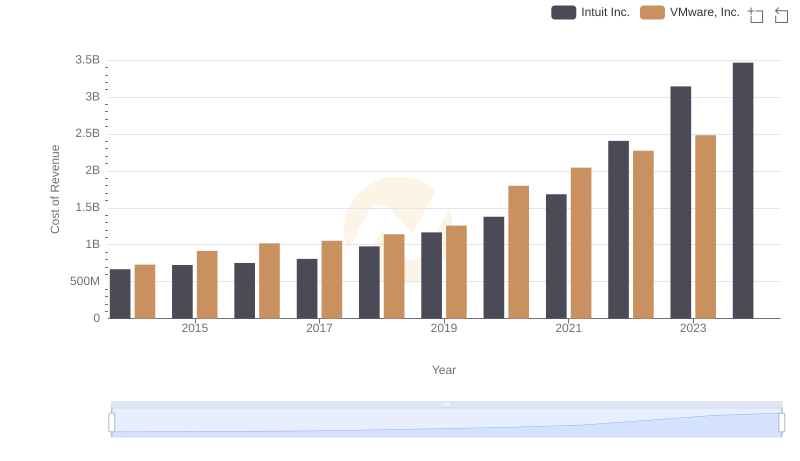
Analyzing Cost of Revenue: Intuit Inc. and VMware, Inc.
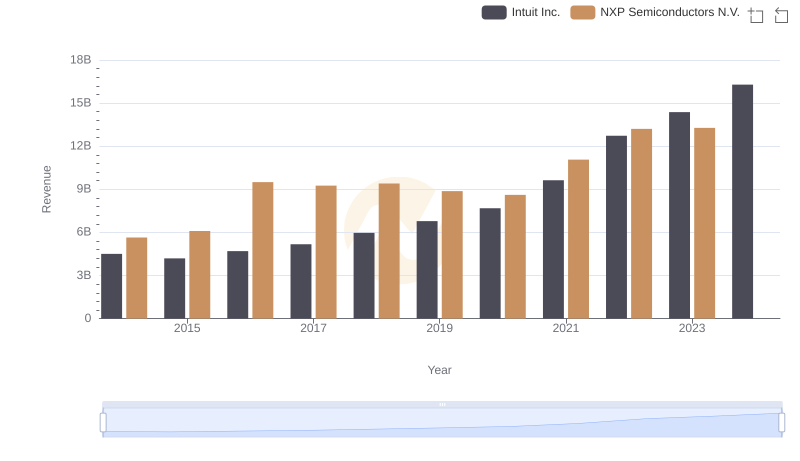
Intuit Inc. and NXP Semiconductors N.V.: A Comprehensive Revenue Analysis
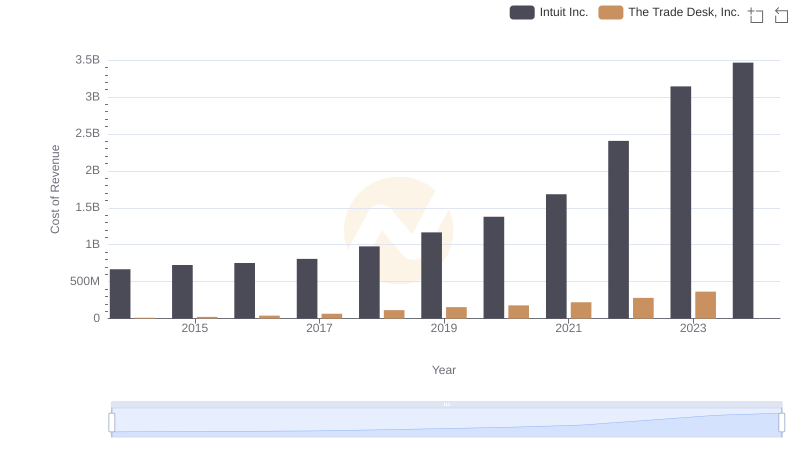
Intuit Inc. vs The Trade Desk, Inc.: Efficiency in Cost of Revenue Explored
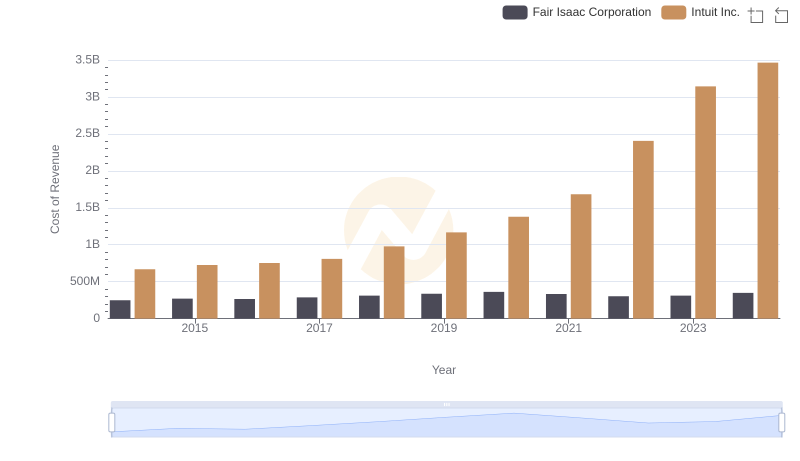
Cost of Revenue Comparison: Intuit Inc. vs Fair Isaac Corporation
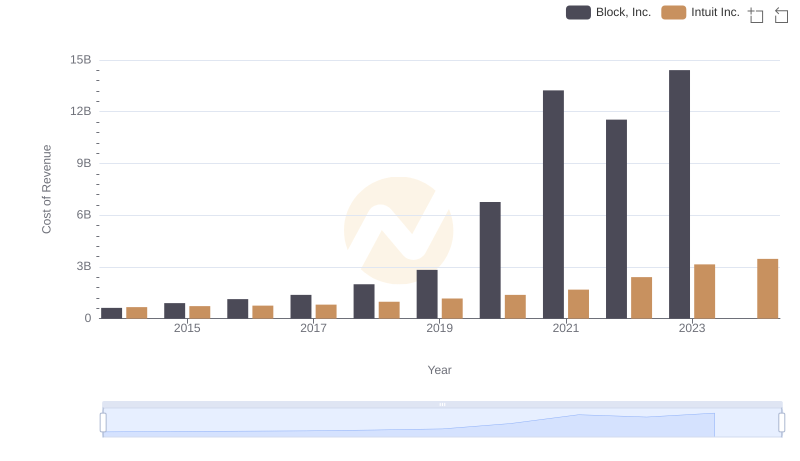
Cost Insights: Breaking Down Intuit Inc. and Block, Inc.'s Expenses
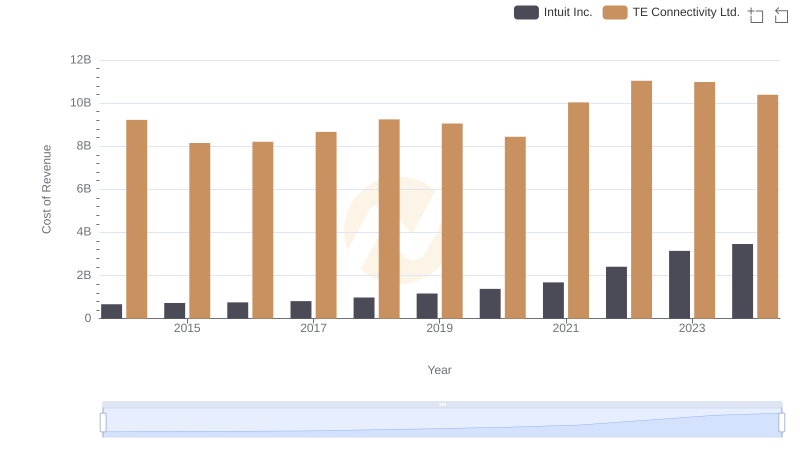
Cost of Revenue: Key Insights for Intuit Inc. and TE Connectivity Ltd.
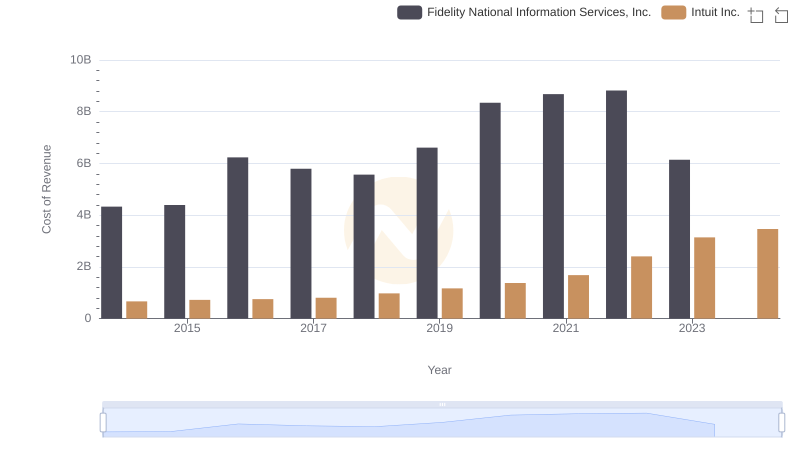
Intuit Inc. vs Fidelity National Information Services, Inc.: Efficiency in Cost of Revenue Explored
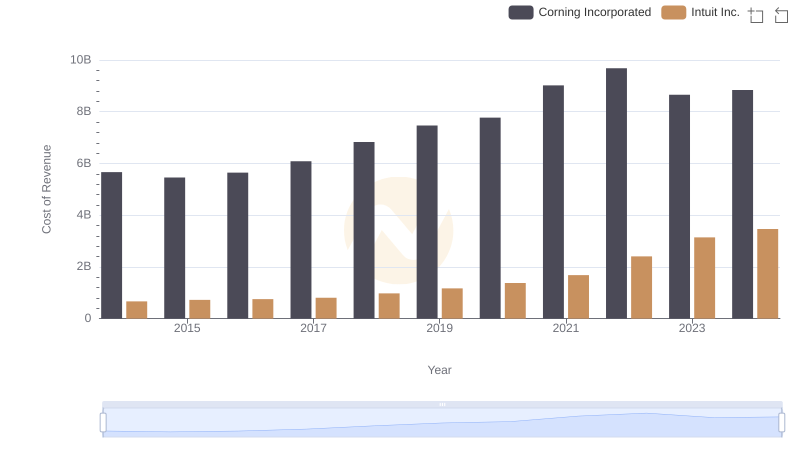
Cost of Revenue Trends: Intuit Inc. vs Corning Incorporated
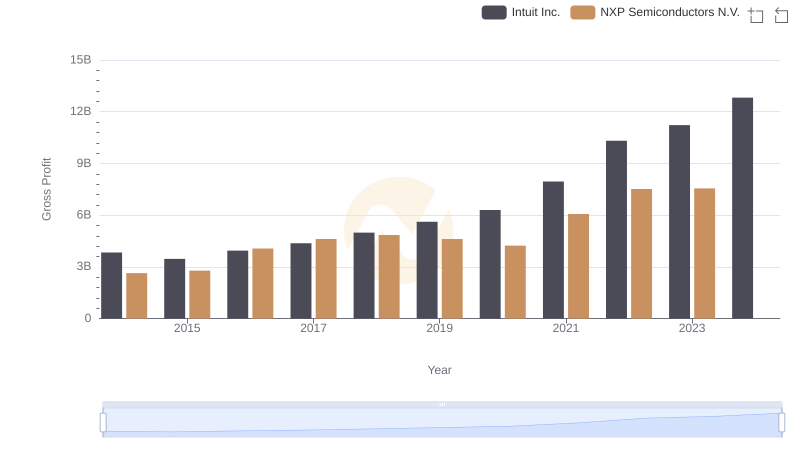
Gross Profit Trends Compared: Intuit Inc. vs NXP Semiconductors N.V.
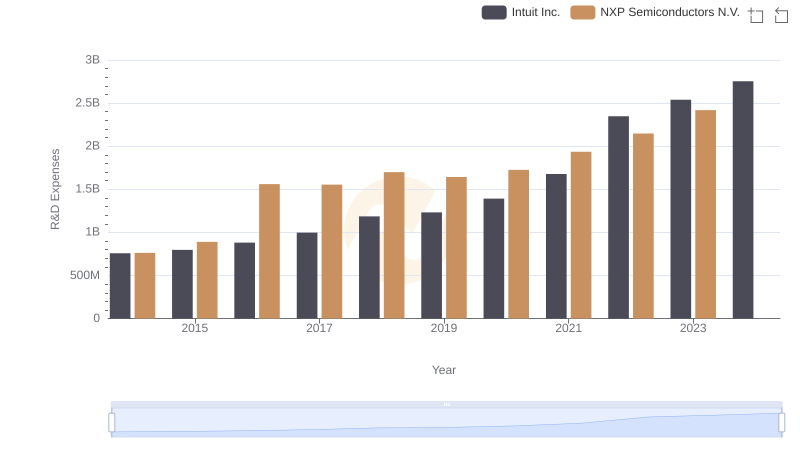
Who Prioritizes Innovation? R&D Spending Compared for Intuit Inc. and NXP Semiconductors N.V.
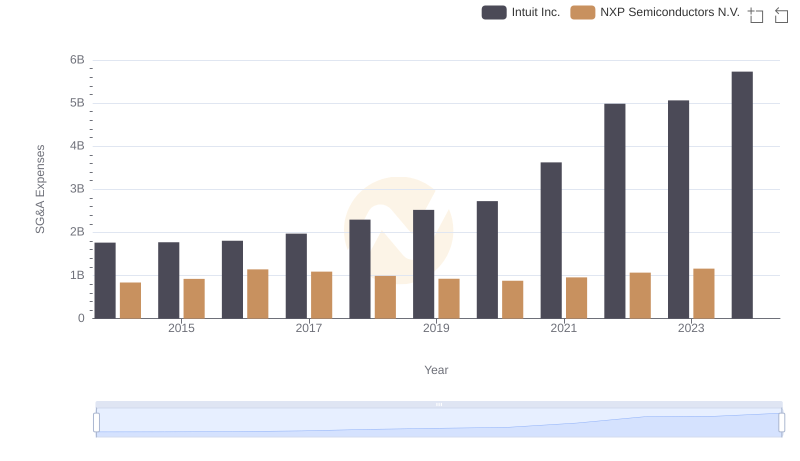
Cost Management Insights: SG&A Expenses for Intuit Inc. and NXP Semiconductors N.V.
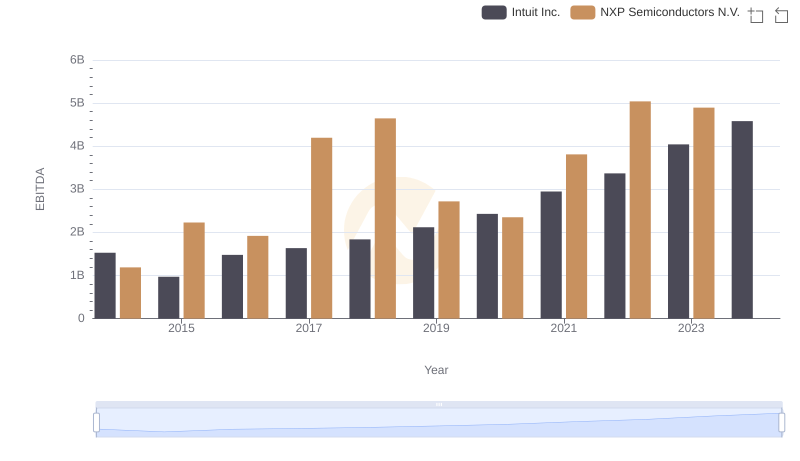
Professional EBITDA Benchmarking: Intuit Inc. vs NXP Semiconductors N.V.