| __timestamp | Intuit Inc. | TE Connectivity Ltd. |
|---|---|---|
| Wednesday, January 1, 2014 | 668000000 | 9220000000 |
| Thursday, January 1, 2015 | 725000000 | 8146000000 |
| Friday, January 1, 2016 | 752000000 | 8205000000 |
| Sunday, January 1, 2017 | 809000000 | 8663000000 |
| Monday, January 1, 2018 | 977000000 | 9243000000 |
| Tuesday, January 1, 2019 | 1167000000 | 9054000000 |
| Wednesday, January 1, 2020 | 1378000000 | 8437000000 |
| Friday, January 1, 2021 | 1683000000 | 10036000000 |
| Saturday, January 1, 2022 | 2406000000 | 11037000000 |
| Sunday, January 1, 2023 | 3143000000 | 10979000000 |
| Monday, January 1, 2024 | 3465000000 | 10389000000 |
In pursuit of knowledge
In the ever-evolving landscape of global business, understanding the cost of revenue is crucial for evaluating a company's financial health. This analysis delves into the cost of revenue trends for Intuit Inc. and TE Connectivity Ltd. from 2014 to 2024. Over this decade, Intuit Inc. has seen a staggering increase of over 400% in its cost of revenue, reflecting its aggressive growth and expansion strategies. In contrast, TE Connectivity Ltd. has maintained a more stable trajectory, with a modest increase of approximately 13% over the same period. This stability underscores TE Connectivity's consistent operational efficiency. The data reveals a fascinating narrative of two companies with distinct financial strategies, offering valuable insights for investors and industry analysts alike. As we move forward, these trends will be pivotal in shaping the competitive dynamics of the tech and connectivity sectors.
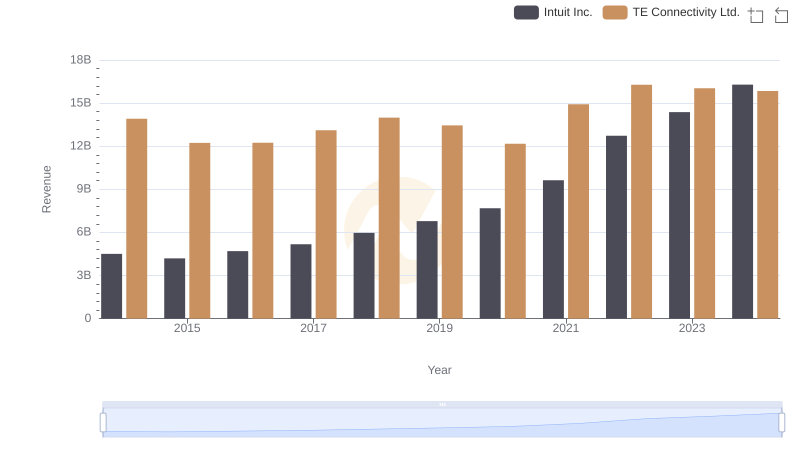
Annual Revenue Comparison: Intuit Inc. vs TE Connectivity Ltd.
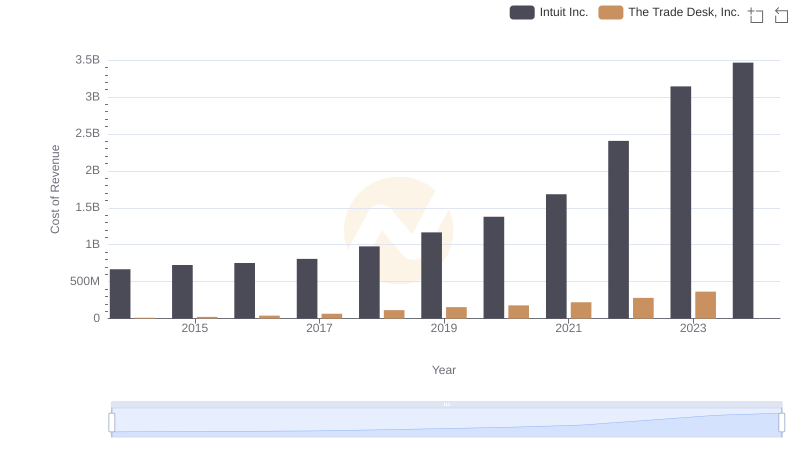
Intuit Inc. vs The Trade Desk, Inc.: Efficiency in Cost of Revenue Explored
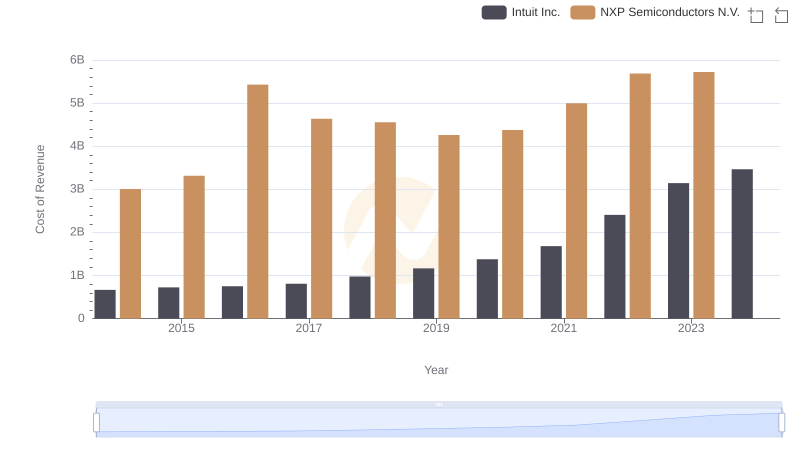
Comparing Cost of Revenue Efficiency: Intuit Inc. vs NXP Semiconductors N.V.
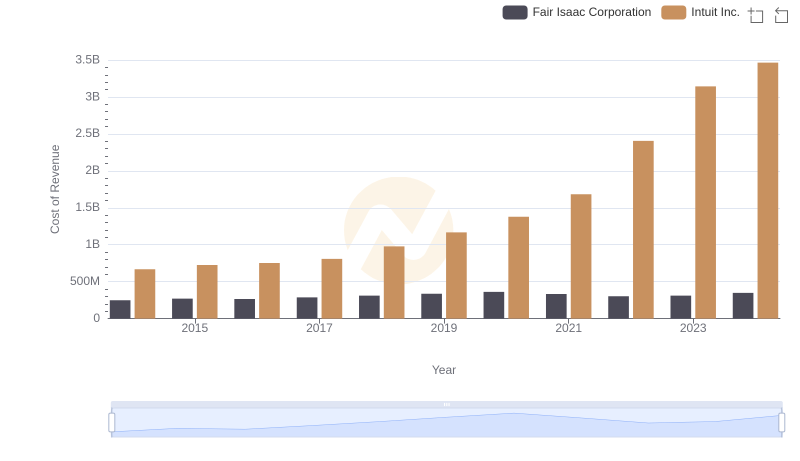
Cost of Revenue Comparison: Intuit Inc. vs Fair Isaac Corporation
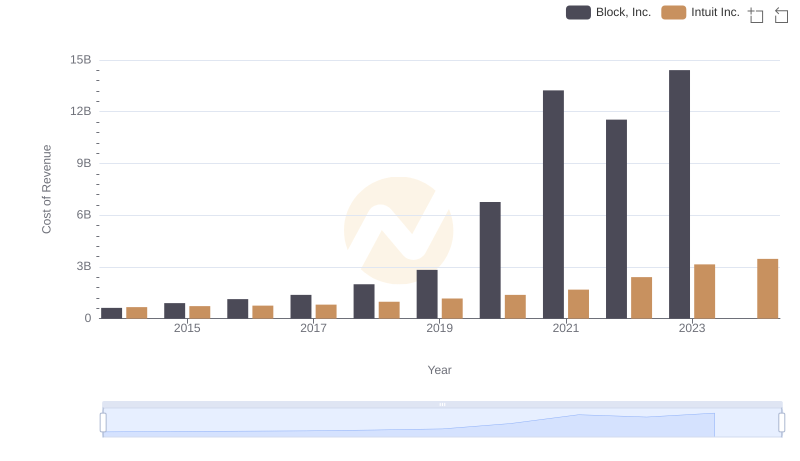
Cost Insights: Breaking Down Intuit Inc. and Block, Inc.'s Expenses
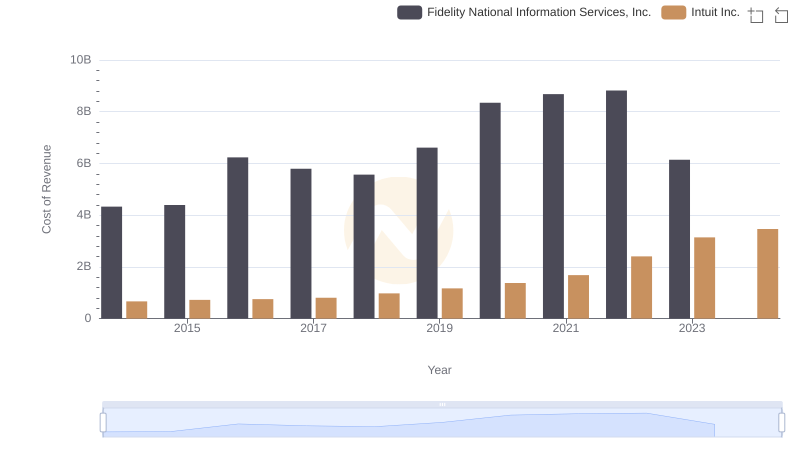
Intuit Inc. vs Fidelity National Information Services, Inc.: Efficiency in Cost of Revenue Explored
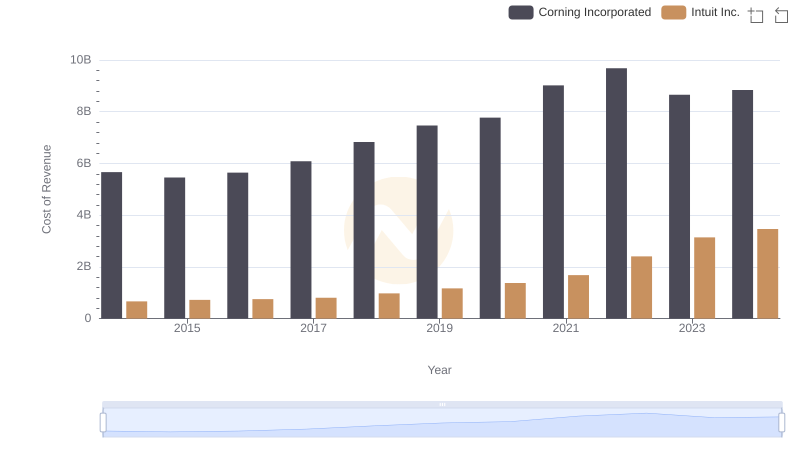
Cost of Revenue Trends: Intuit Inc. vs Corning Incorporated
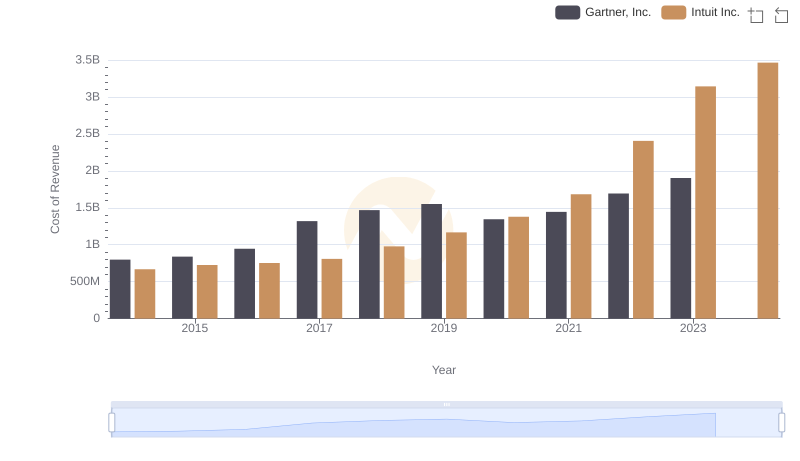
Intuit Inc. vs Gartner, Inc.: Efficiency in Cost of Revenue Explored
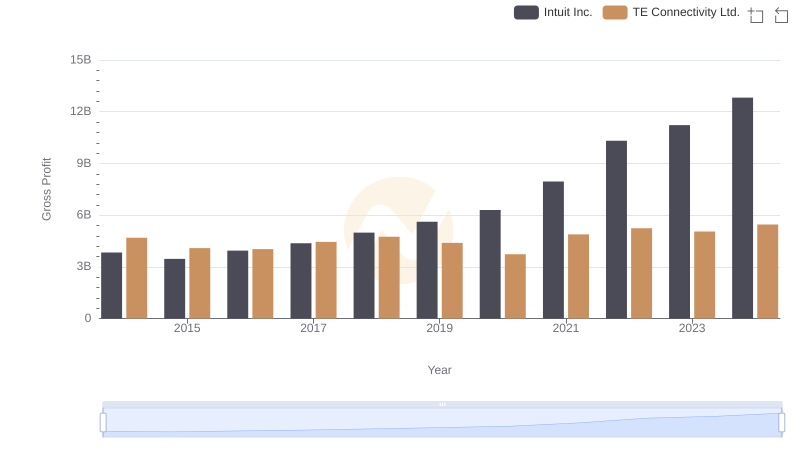
Intuit Inc. vs TE Connectivity Ltd.: A Gross Profit Performance Breakdown
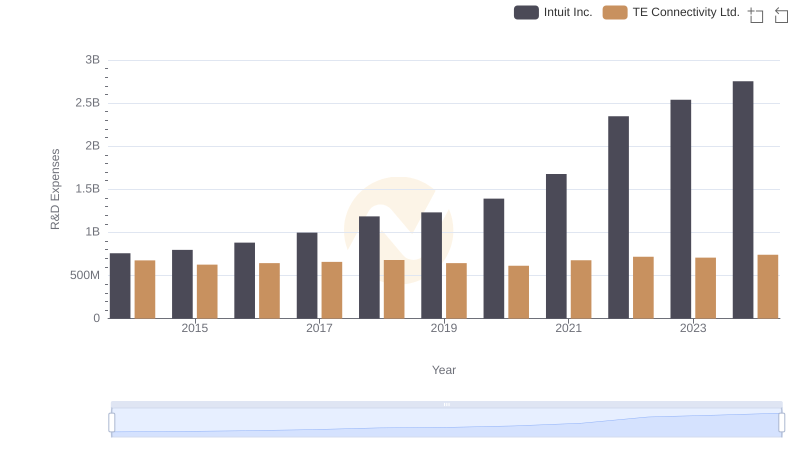
Intuit Inc. or TE Connectivity Ltd.: Who Invests More in Innovation?
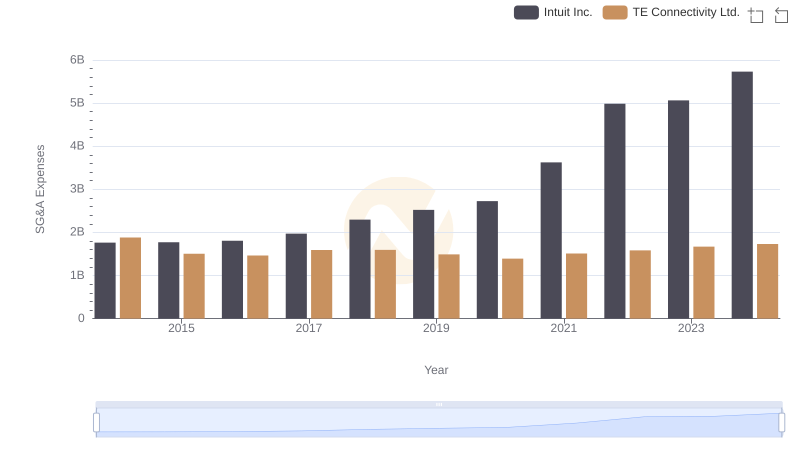
Cost Management Insights: SG&A Expenses for Intuit Inc. and TE Connectivity Ltd.
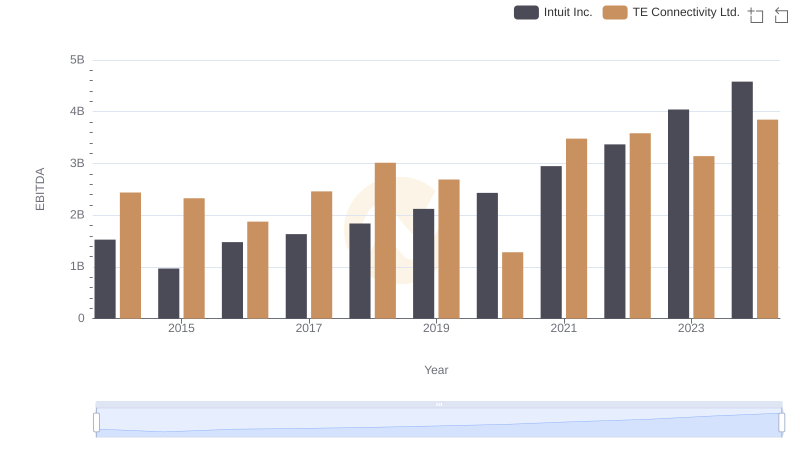
Intuit Inc. vs TE Connectivity Ltd.: In-Depth EBITDA Performance Comparison