| __timestamp | Intuit Inc. | The Trade Desk, Inc. |
|---|---|---|
| Wednesday, January 1, 2014 | 1762000000 | 23975000 |
| Thursday, January 1, 2015 | 1771000000 | 40070000 |
| Friday, January 1, 2016 | 1807000000 | 78219000 |
| Sunday, January 1, 2017 | 1973000000 | 119825000 |
| Monday, January 1, 2018 | 2298000000 | 171981000 |
| Tuesday, January 1, 2019 | 2524000000 | 275930000 |
| Wednesday, January 1, 2020 | 2727000000 | 346359000 |
| Friday, January 1, 2021 | 3626000000 | 623959000 |
| Saturday, January 1, 2022 | 4986000000 | 863142000 |
| Sunday, January 1, 2023 | 5062000000 | 968248000 |
| Monday, January 1, 2024 | 5730000000 | 1082333000 |
Cracking the code
In the ever-evolving landscape of corporate finance, understanding the trends in Selling, General, and Administrative (SG&A) expenses is crucial for investors and analysts alike. Over the past decade, Intuit Inc. and The Trade Desk, Inc. have showcased contrasting trajectories in their SG&A expenditures. From 2014 to 2023, Intuit's SG&A expenses surged by over 225%, reflecting its aggressive growth and expansion strategies. In contrast, The Trade Desk, Inc. experienced a remarkable 3,930% increase, albeit from a much smaller base, highlighting its rapid scaling in the digital advertising space.
While Intuit's expenses consistently grew year-on-year, The Trade Desk's expenses saw a more volatile pattern, with significant jumps in recent years. Notably, data for 2024 is missing for The Trade Desk, indicating potential reporting delays or strategic shifts. These trends offer a window into each company's operational priorities and market positioning.
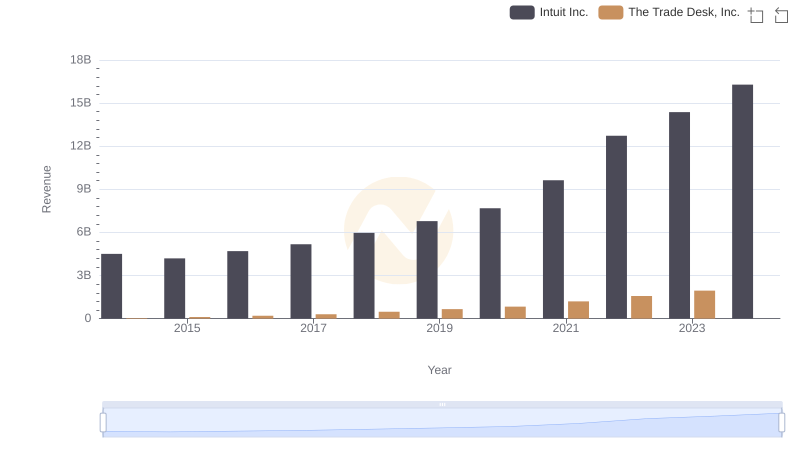
Revenue Insights: Intuit Inc. and The Trade Desk, Inc. Performance Compared
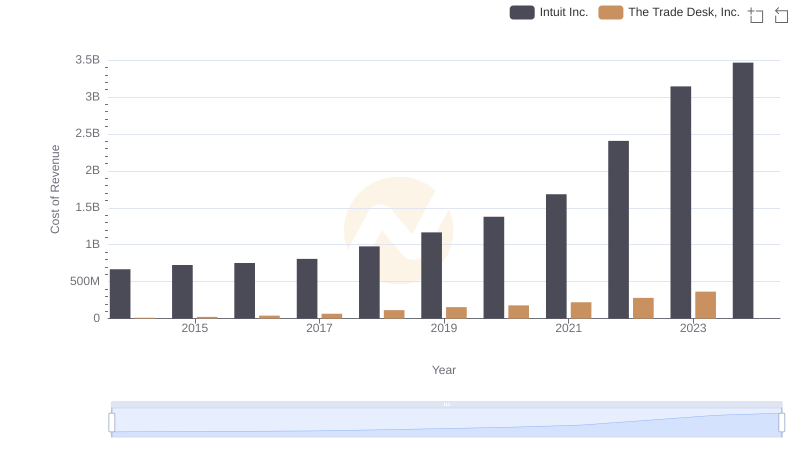
Intuit Inc. vs The Trade Desk, Inc.: Efficiency in Cost of Revenue Explored
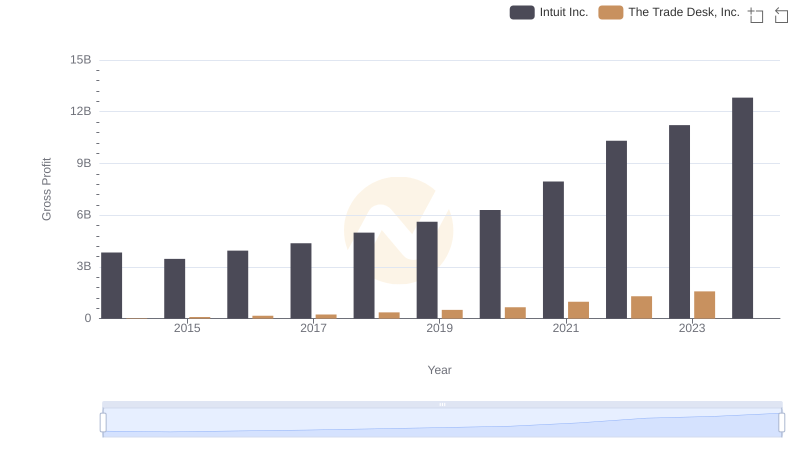
Gross Profit Comparison: Intuit Inc. and The Trade Desk, Inc. Trends
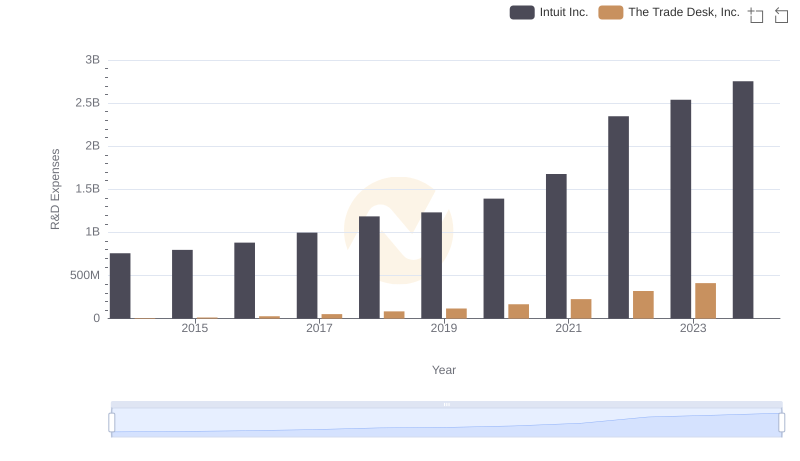
Research and Development Expenses Breakdown: Intuit Inc. vs The Trade Desk, Inc.
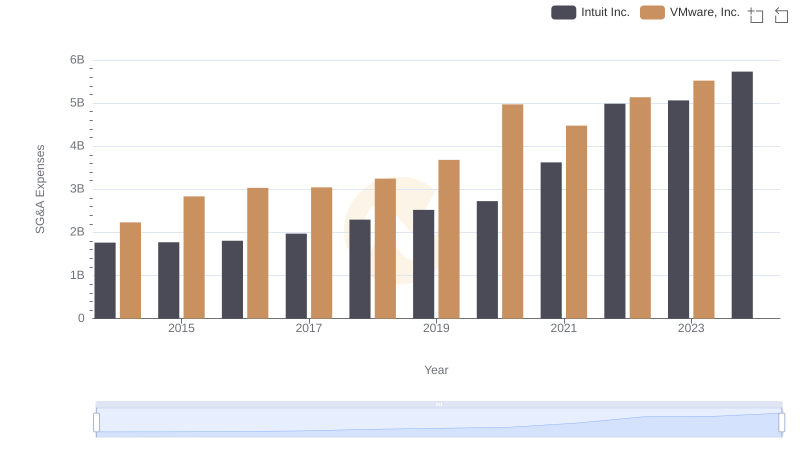
Cost Management Insights: SG&A Expenses for Intuit Inc. and VMware, Inc.
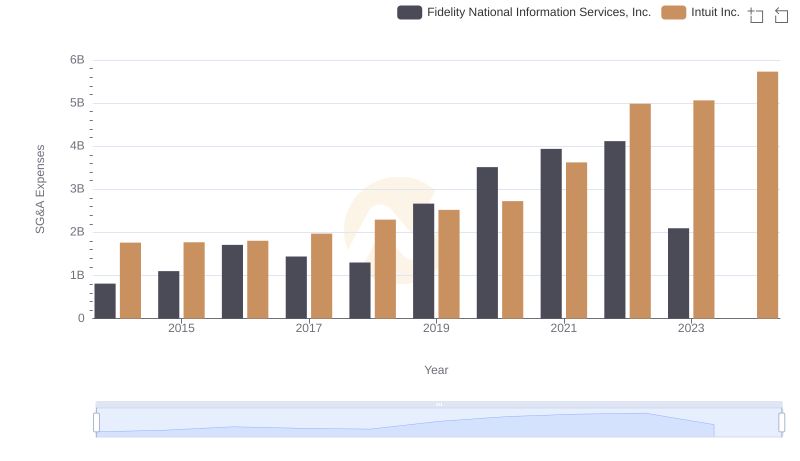
Comparing SG&A Expenses: Intuit Inc. vs Fidelity National Information Services, Inc. Trends and Insights
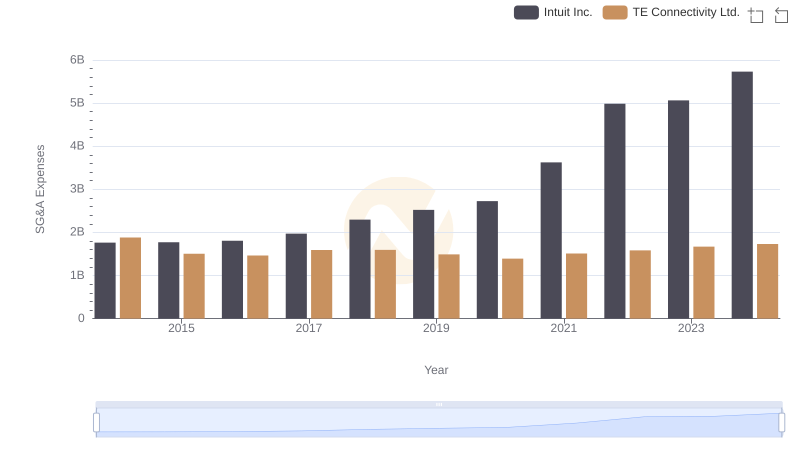
Cost Management Insights: SG&A Expenses for Intuit Inc. and TE Connectivity Ltd.
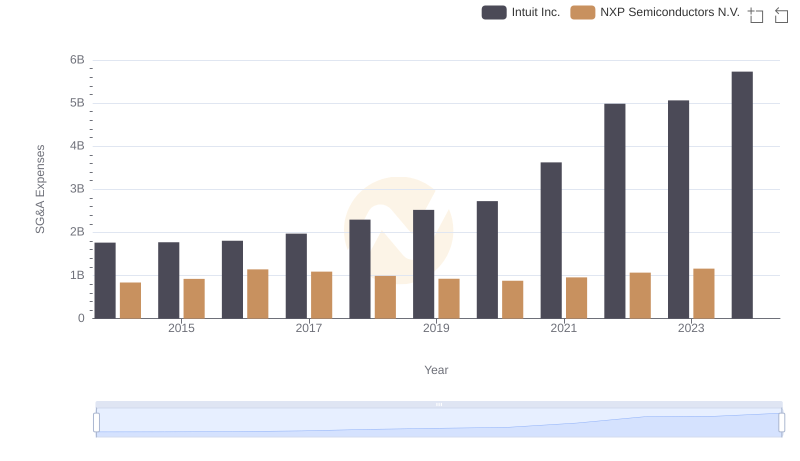
Cost Management Insights: SG&A Expenses for Intuit Inc. and NXP Semiconductors N.V.
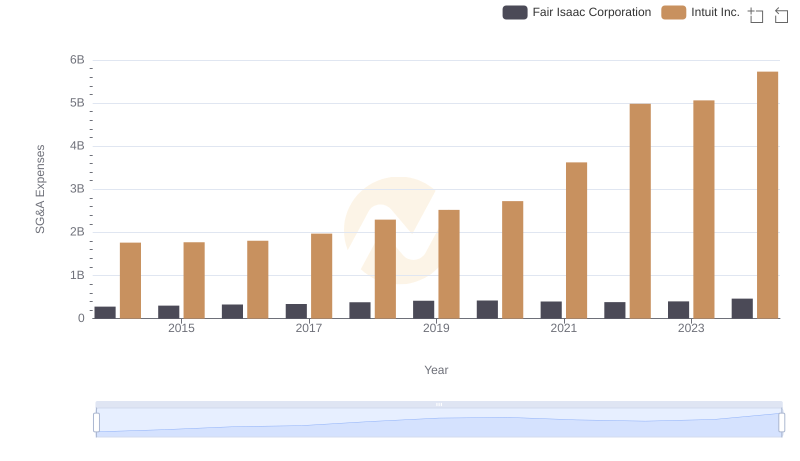
Comparing SG&A Expenses: Intuit Inc. vs Fair Isaac Corporation Trends and Insights
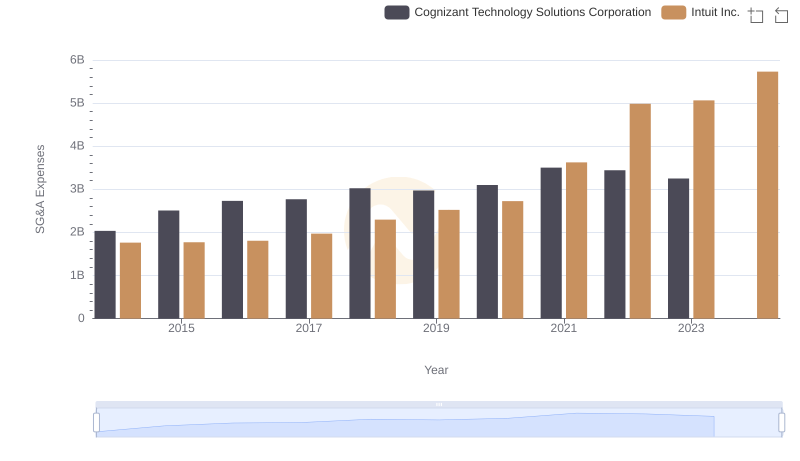
Cost Management Insights: SG&A Expenses for Intuit Inc. and Cognizant Technology Solutions Corporation
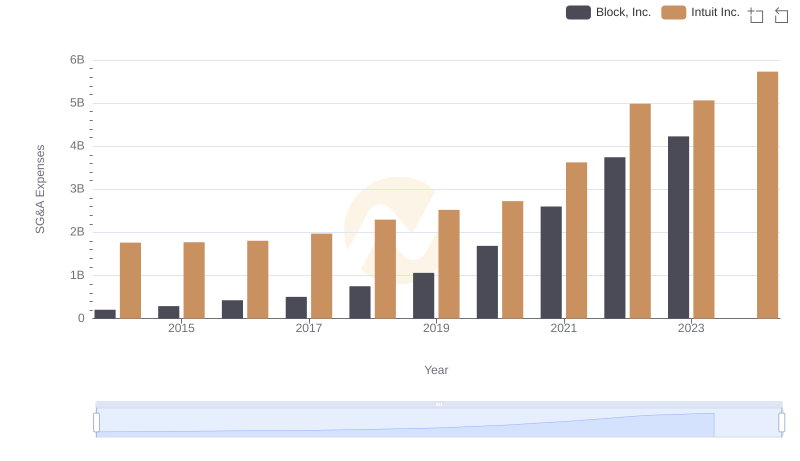
Intuit Inc. vs Block, Inc.: SG&A Expense Trends
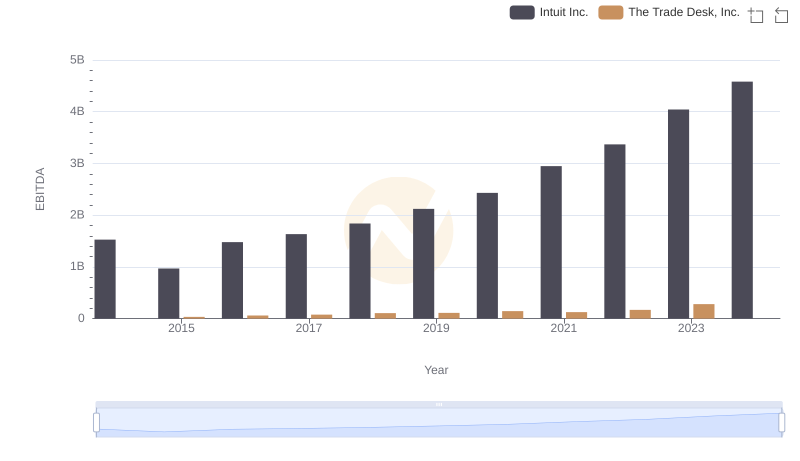
EBITDA Metrics Evaluated: Intuit Inc. vs The Trade Desk, Inc.