| __timestamp | Applied Materials, Inc. | Intuit Inc. |
|---|---|---|
| Wednesday, January 1, 2014 | 890000000 | 1762000000 |
| Thursday, January 1, 2015 | 897000000 | 1771000000 |
| Friday, January 1, 2016 | 819000000 | 1807000000 |
| Sunday, January 1, 2017 | 890000000 | 1973000000 |
| Monday, January 1, 2018 | 1002000000 | 2298000000 |
| Tuesday, January 1, 2019 | 982000000 | 2524000000 |
| Wednesday, January 1, 2020 | 1093000000 | 2727000000 |
| Friday, January 1, 2021 | 1229000000 | 3626000000 |
| Saturday, January 1, 2022 | 1438000000 | 4986000000 |
| Sunday, January 1, 2023 | 1628000000 | 5062000000 |
| Monday, January 1, 2024 | 1797000000 | 5730000000 |
Unlocking the unknown
In the ever-evolving landscape of corporate finance, understanding the spending patterns of industry giants can offer valuable insights. Over the past decade, Intuit Inc. and Applied Materials, Inc. have demonstrated distinct trajectories in their Selling, General, and Administrative (SG&A) expenses. From 2014 to 2024, Intuit's SG&A expenses surged by approximately 225%, reflecting its aggressive growth strategy and market expansion. In contrast, Applied Materials saw a more modest increase of around 100%, indicating a steady yet cautious approach.
These patterns underscore the strategic priorities of each company, offering a window into their operational philosophies.
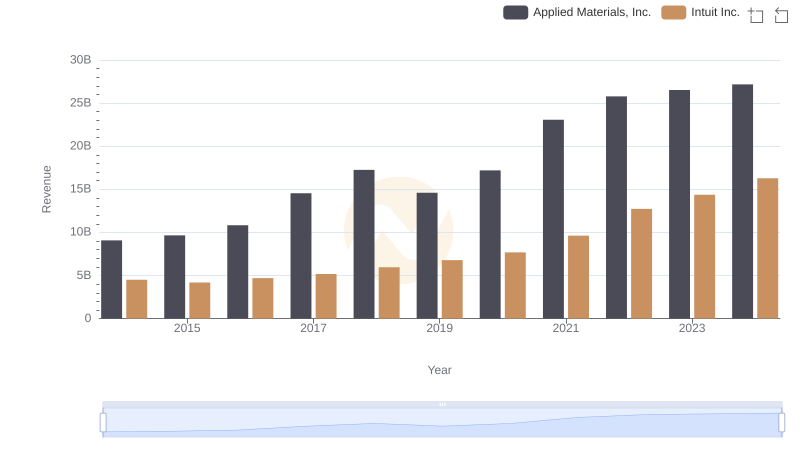
Revenue Insights: Intuit Inc. and Applied Materials, Inc. Performance Compared
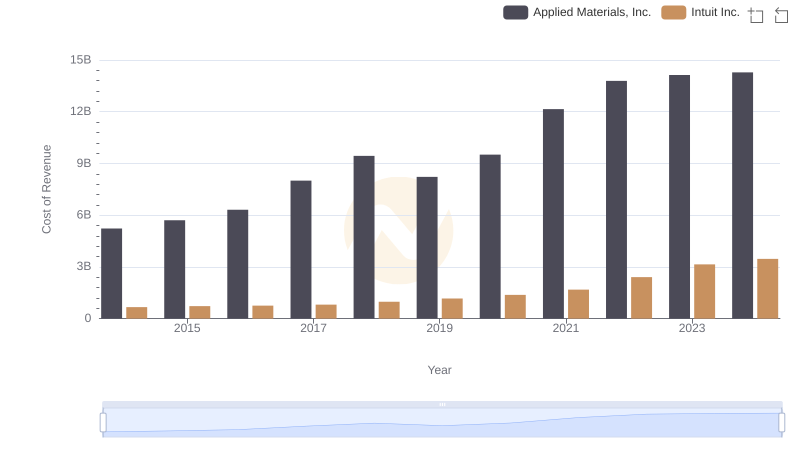
Cost of Revenue Comparison: Intuit Inc. vs Applied Materials, Inc.
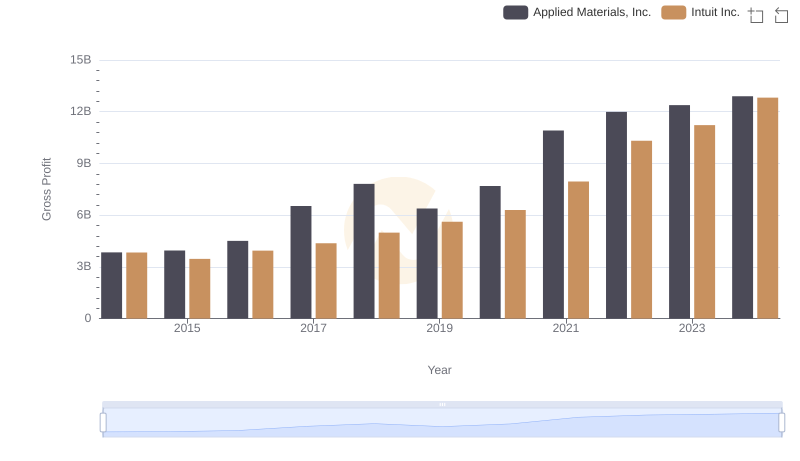
Intuit Inc. and Applied Materials, Inc.: A Detailed Gross Profit Analysis
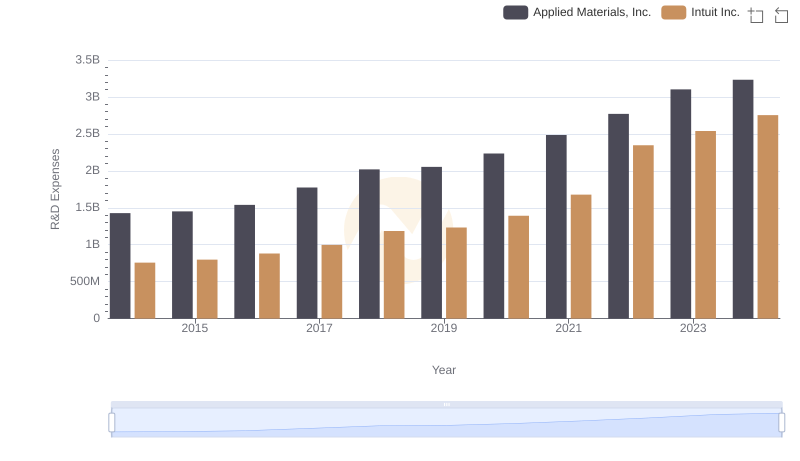
Research and Development Expenses Breakdown: Intuit Inc. vs Applied Materials, Inc.
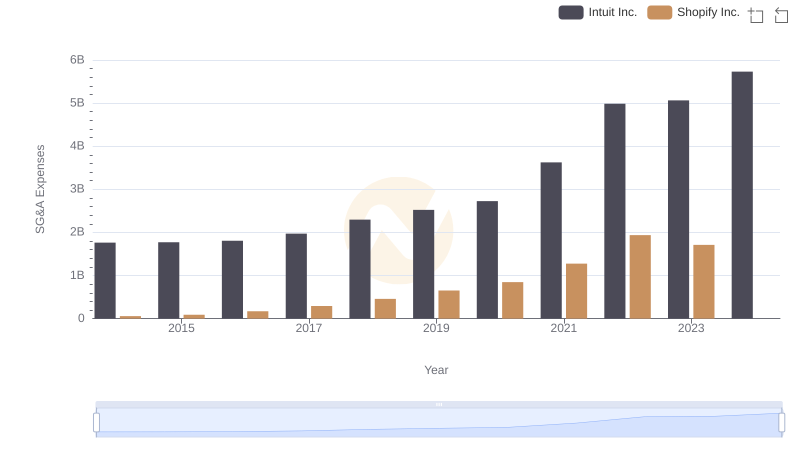
Who Optimizes SG&A Costs Better? Intuit Inc. or Shopify Inc.
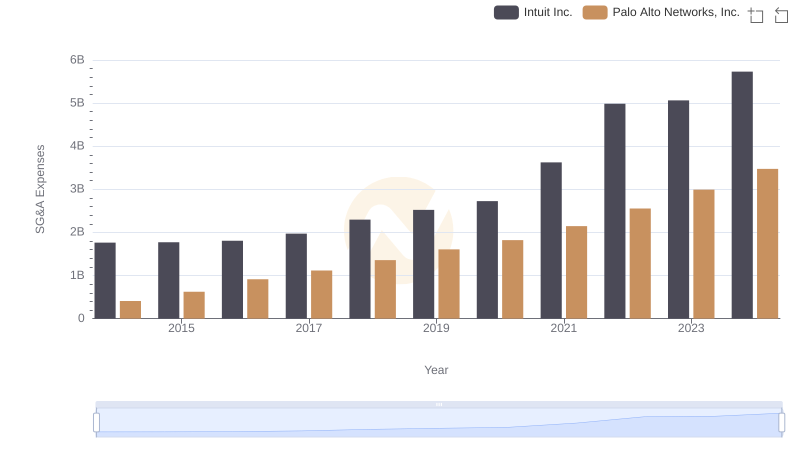
Comparing SG&A Expenses: Intuit Inc. vs Palo Alto Networks, Inc. Trends and Insights
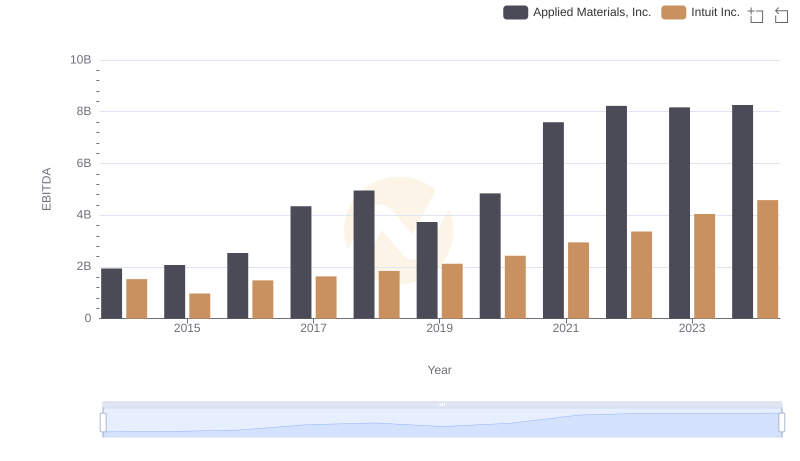
EBITDA Performance Review: Intuit Inc. vs Applied Materials, Inc.

Cost Management Insights: SG&A Expenses for Intuit Inc. and Fiserv, Inc.
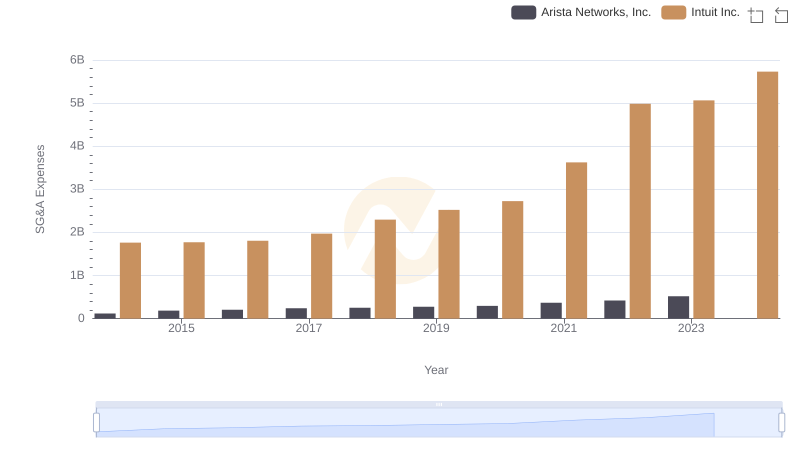
Operational Costs Compared: SG&A Analysis of Intuit Inc. and Arista Networks, Inc.
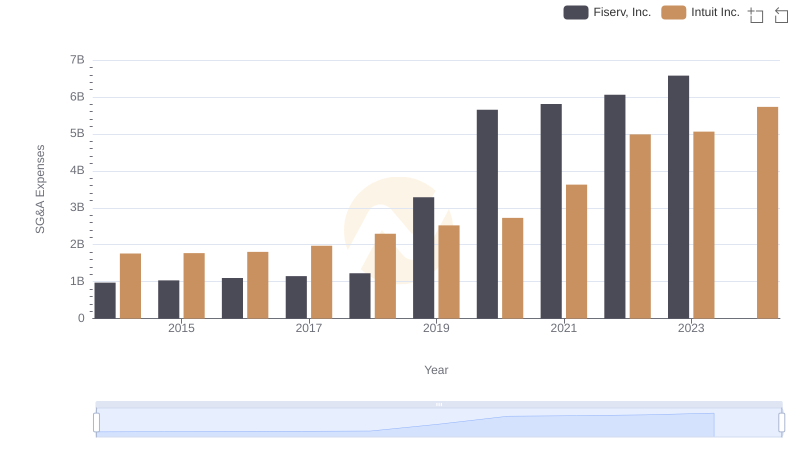
Intuit Inc. or Fiserv, Inc.: Who Manages SG&A Costs Better?
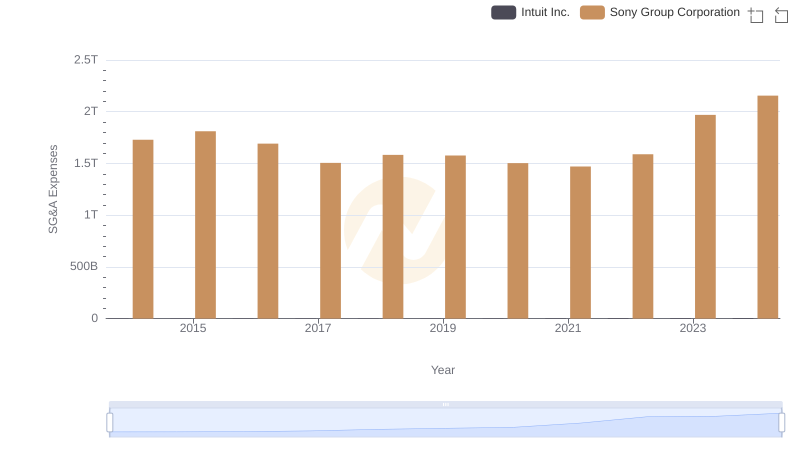
Who Optimizes SG&A Costs Better? Intuit Inc. or Sony Group Corporation
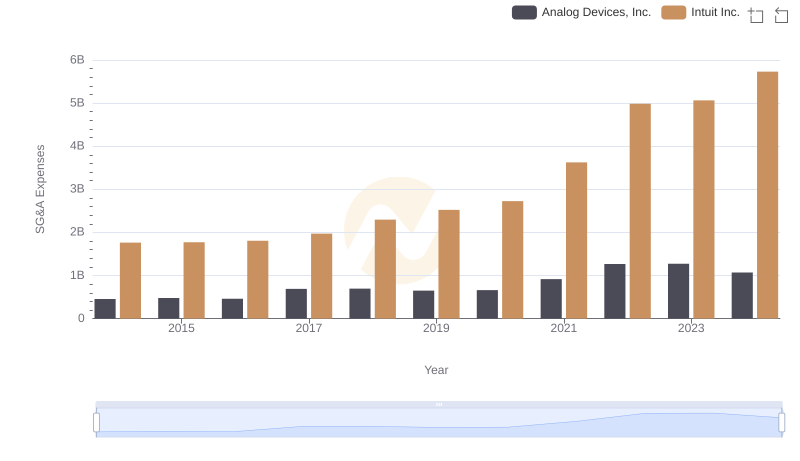
Who Optimizes SG&A Costs Better? Intuit Inc. or Analog Devices, Inc.