| __timestamp | Applied Materials, Inc. | Intuit Inc. |
|---|---|---|
| Wednesday, January 1, 2014 | 1428000000 | 758000000 |
| Thursday, January 1, 2015 | 1451000000 | 798000000 |
| Friday, January 1, 2016 | 1540000000 | 881000000 |
| Sunday, January 1, 2017 | 1774000000 | 998000000 |
| Monday, January 1, 2018 | 2019000000 | 1186000000 |
| Tuesday, January 1, 2019 | 2054000000 | 1233000000 |
| Wednesday, January 1, 2020 | 2234000000 | 1392000000 |
| Friday, January 1, 2021 | 2485000000 | 1678000000 |
| Saturday, January 1, 2022 | 2771000000 | 2347000000 |
| Sunday, January 1, 2023 | 3102000000 | 2539000000 |
| Monday, January 1, 2024 | 3233000000 | 2754000000 |
Unleashing insights
In the ever-evolving landscape of technology, research and development (R&D) expenses serve as a barometer of innovation. Over the past decade, Intuit Inc. and Applied Materials, Inc. have demonstrated a steadfast commitment to advancing their technological prowess. From 2014 to 2024, Applied Materials, Inc. has seen its R&D expenses grow by approximately 126%, reflecting its dedication to maintaining a competitive edge in the semiconductor industry. Meanwhile, Intuit Inc., a leader in financial software, has increased its R&D spending by around 263%, underscoring its focus on enhancing user experience and expanding its product offerings.
The data reveals a fascinating trend: while both companies have significantly ramped up their R&D investments, Intuit's growth rate outpaces that of Applied Materials. This divergence highlights the distinct strategic priorities of each company, with Intuit aggressively pursuing innovation to capture new market opportunities.
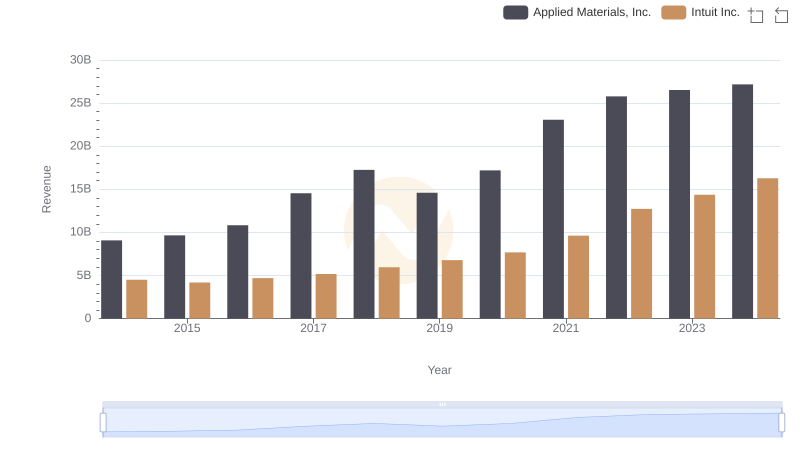
Revenue Insights: Intuit Inc. and Applied Materials, Inc. Performance Compared
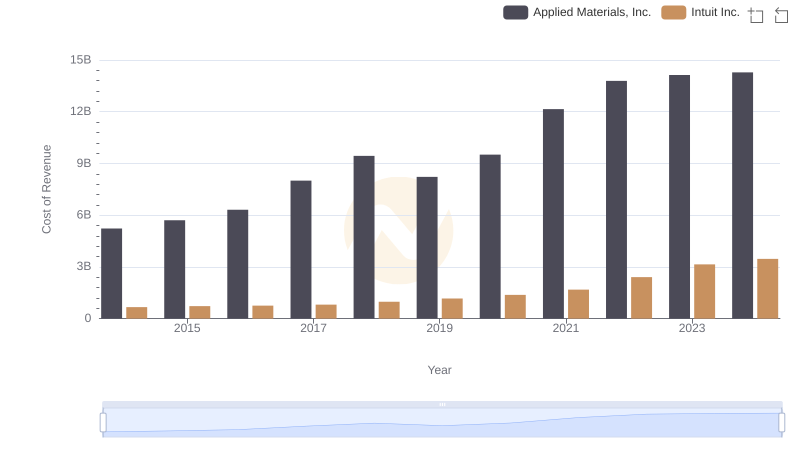
Cost of Revenue Comparison: Intuit Inc. vs Applied Materials, Inc.
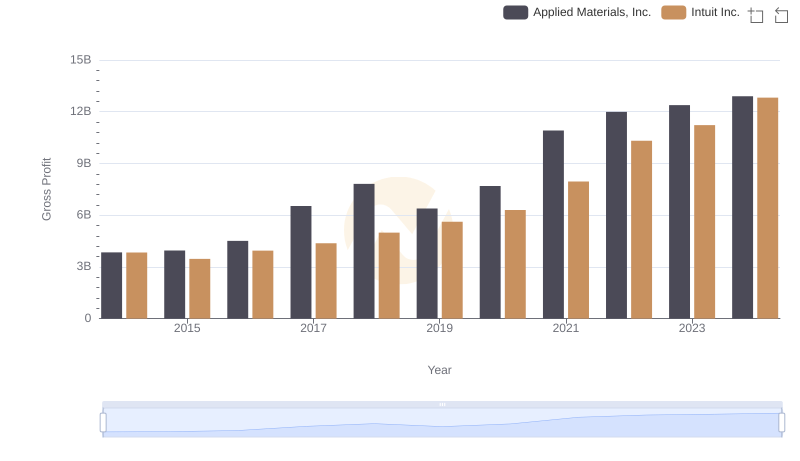
Intuit Inc. and Applied Materials, Inc.: A Detailed Gross Profit Analysis
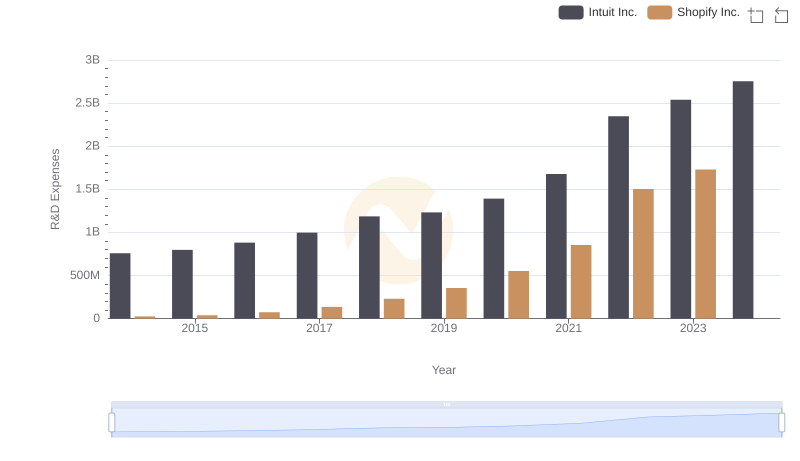
Research and Development: Comparing Key Metrics for Intuit Inc. and Shopify Inc.
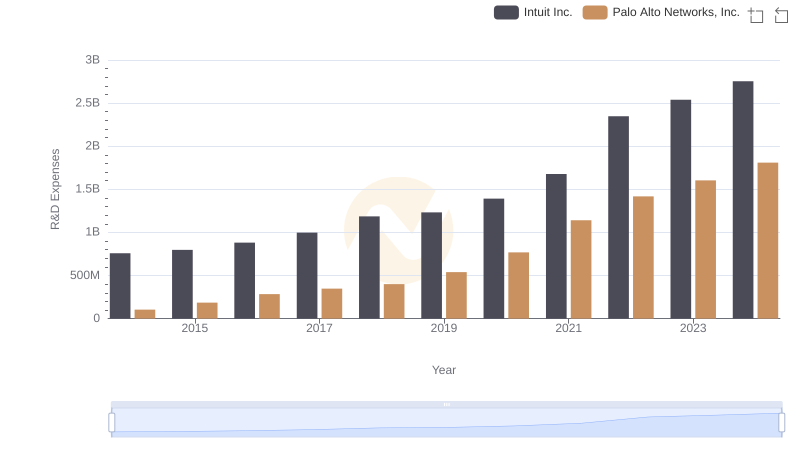
Comparing Innovation Spending: Intuit Inc. and Palo Alto Networks, Inc.
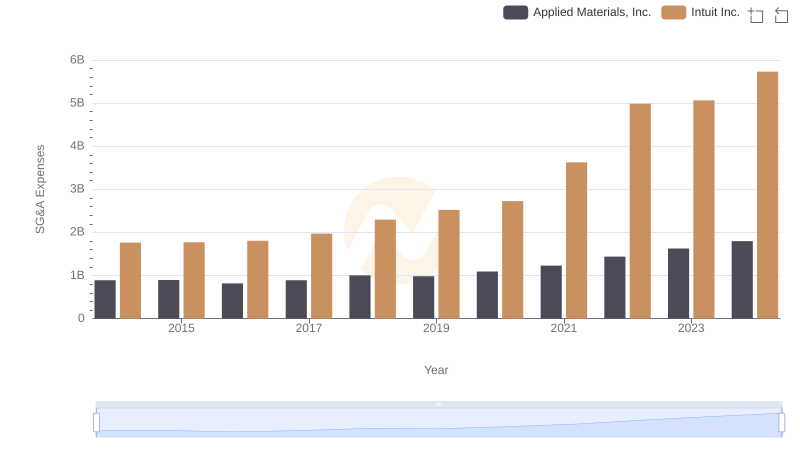
Intuit Inc. and Applied Materials, Inc.: SG&A Spending Patterns Compared
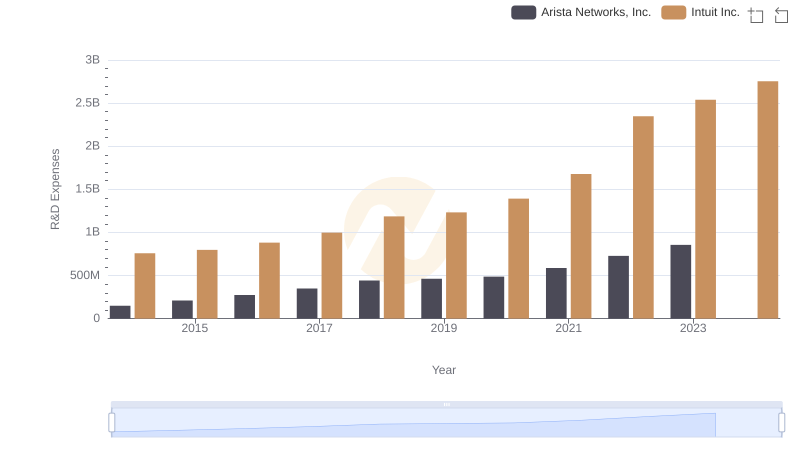
Intuit Inc. or Arista Networks, Inc.: Who Invests More in Innovation?
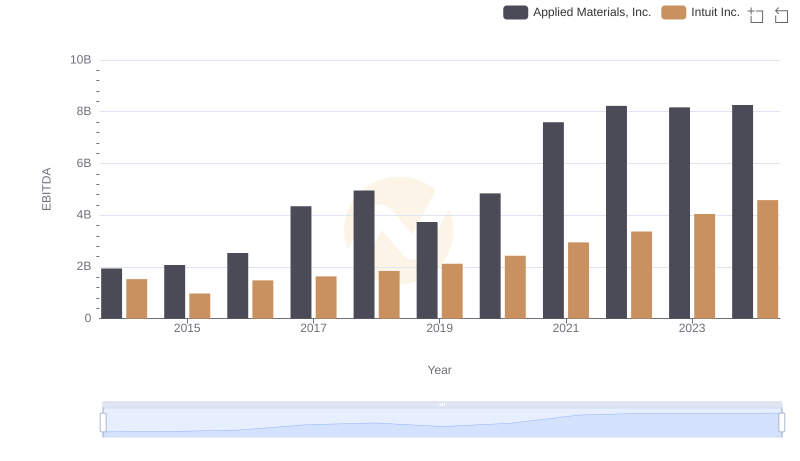
EBITDA Performance Review: Intuit Inc. vs Applied Materials, Inc.
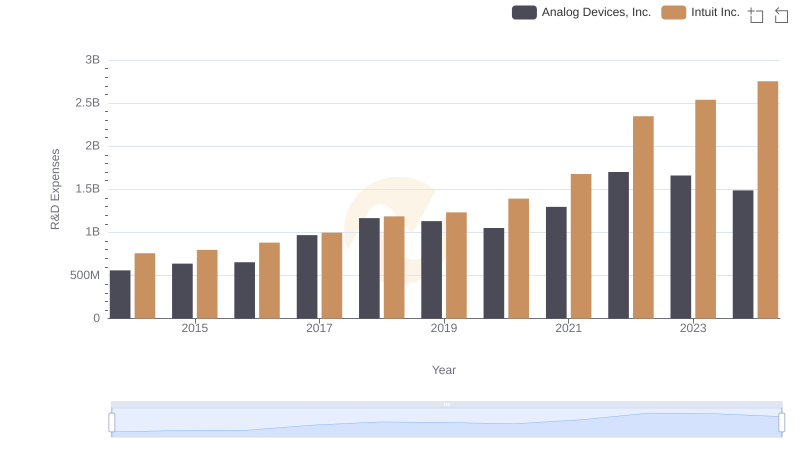
Research and Development Investment: Intuit Inc. vs Analog Devices, Inc.
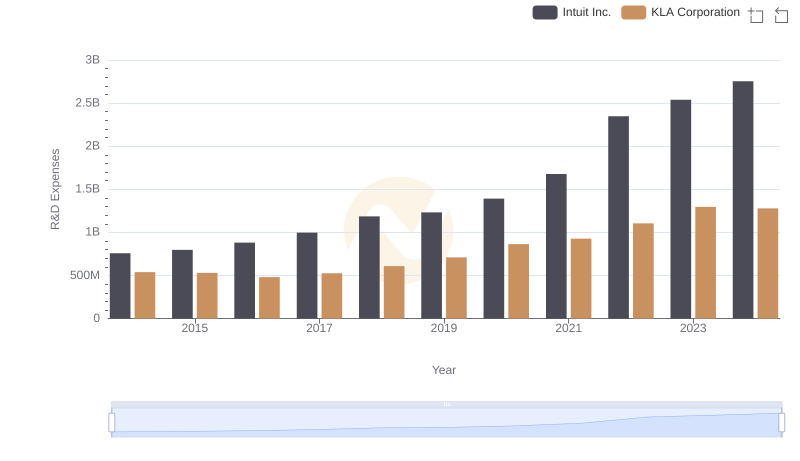
Research and Development: Comparing Key Metrics for Intuit Inc. and KLA Corporation
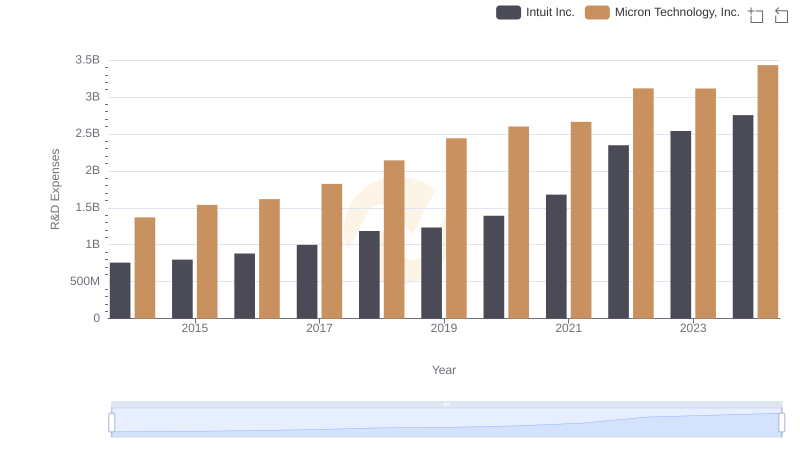
Who Prioritizes Innovation? R&D Spending Compared for Intuit Inc. and Micron Technology, Inc.
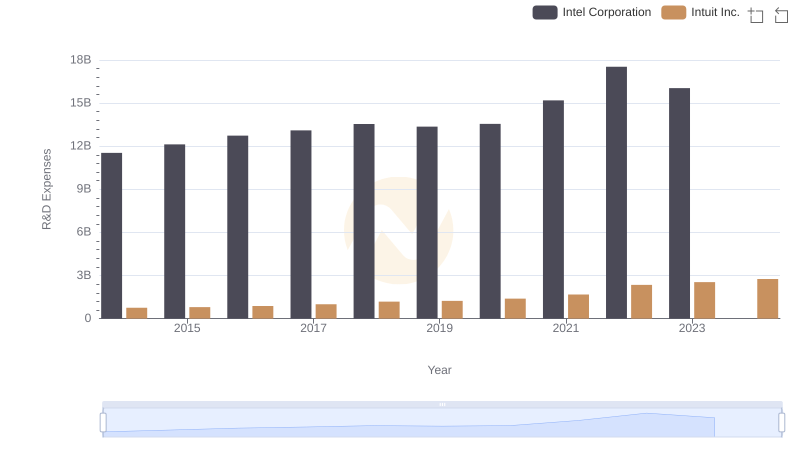
R&D Insights: How Intuit Inc. and Intel Corporation Allocate Funds