| __timestamp | Applied Materials, Inc. | Intuit Inc. |
|---|---|---|
| Wednesday, January 1, 2014 | 5229000000 | 668000000 |
| Thursday, January 1, 2015 | 5707000000 | 725000000 |
| Friday, January 1, 2016 | 6314000000 | 752000000 |
| Sunday, January 1, 2017 | 8005000000 | 809000000 |
| Monday, January 1, 2018 | 9436000000 | 977000000 |
| Tuesday, January 1, 2019 | 8222000000 | 1167000000 |
| Wednesday, January 1, 2020 | 9510000000 | 1378000000 |
| Friday, January 1, 2021 | 12149000000 | 1683000000 |
| Saturday, January 1, 2022 | 13792000000 | 2406000000 |
| Sunday, January 1, 2023 | 14133000000 | 3143000000 |
| Monday, January 1, 2024 | 14279000000 | 3465000000 |
Data in motion
In the ever-evolving landscape of technology, Intuit Inc. and Applied Materials, Inc. stand as titans, each with a unique narrative. Over the past decade, from 2014 to 2024, Applied Materials has consistently outpaced Intuit in terms of cost of revenue, reflecting its expansive operations in the semiconductor industry. In 2024, Applied Materials' cost of revenue reached approximately $14.3 billion, marking a 173% increase from 2014. Meanwhile, Intuit, a leader in financial software, saw its cost of revenue grow by over 418% during the same period, reaching around $3.5 billion in 2024. This stark contrast highlights the differing scales and operational demands of these two industry leaders. As we delve into these figures, it becomes evident that while both companies are growing, their paths and challenges are distinct, offering a fascinating glimpse into the dynamics of the tech world.
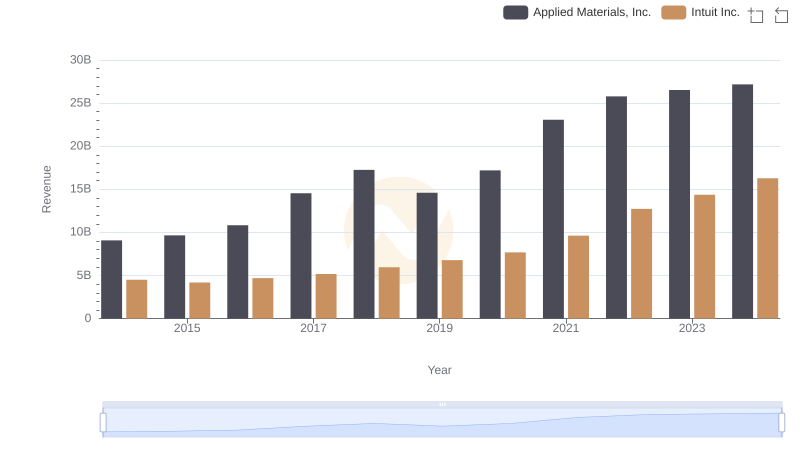
Revenue Insights: Intuit Inc. and Applied Materials, Inc. Performance Compared

Cost Insights: Breaking Down Intuit Inc. and Shopify Inc.'s Expenses
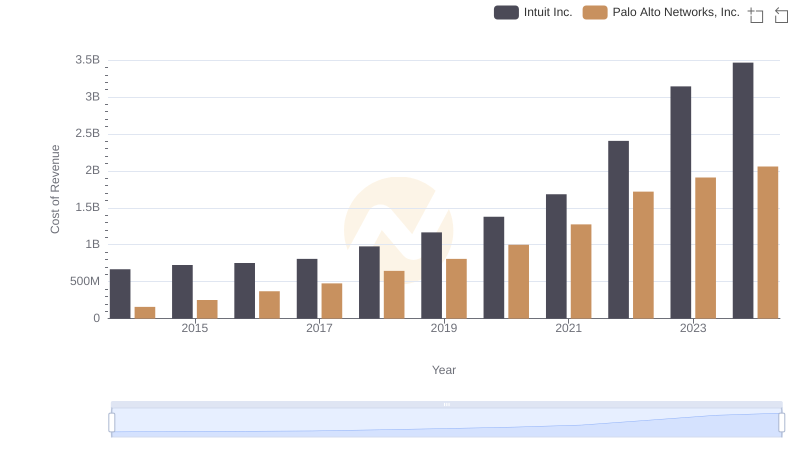
Cost Insights: Breaking Down Intuit Inc. and Palo Alto Networks, Inc.'s Expenses
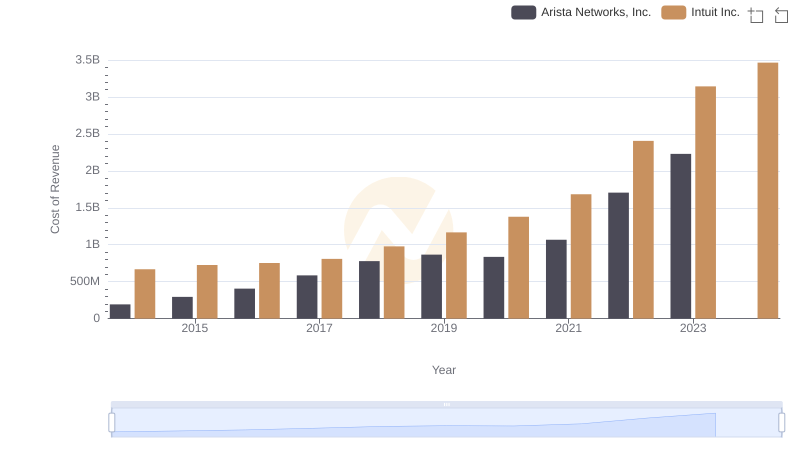
Cost of Revenue: Key Insights for Intuit Inc. and Arista Networks, Inc.
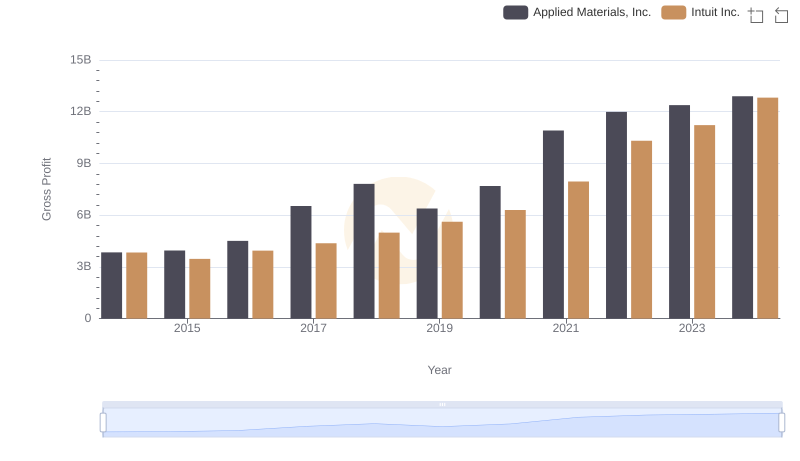
Intuit Inc. and Applied Materials, Inc.: A Detailed Gross Profit Analysis
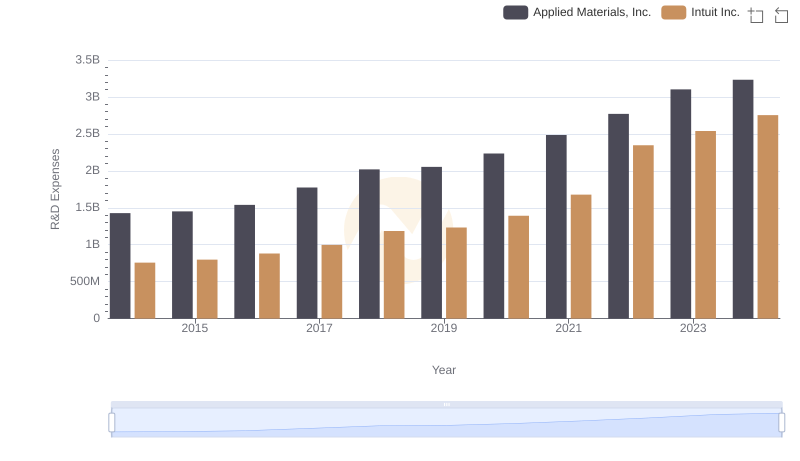
Research and Development Expenses Breakdown: Intuit Inc. vs Applied Materials, Inc.
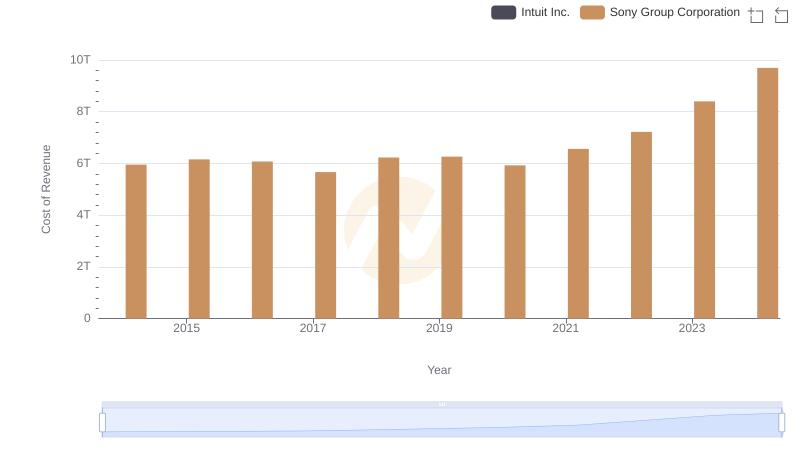
Cost of Revenue Trends: Intuit Inc. vs Sony Group Corporation
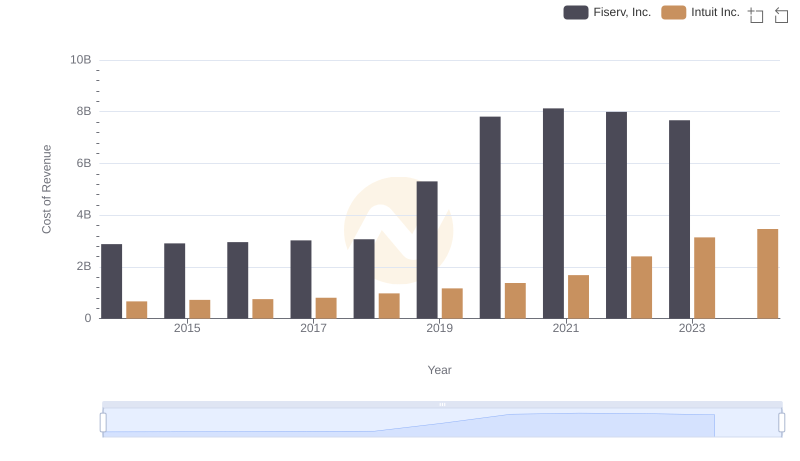
Cost Insights: Breaking Down Intuit Inc. and Fiserv, Inc.'s Expenses
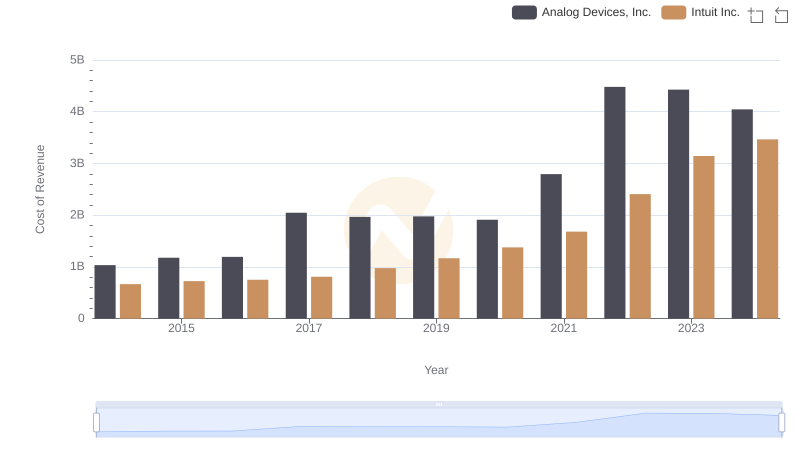
Cost Insights: Breaking Down Intuit Inc. and Analog Devices, Inc.'s Expenses

Cost Insights: Breaking Down Intuit Inc. and Fiserv, Inc.'s Expenses
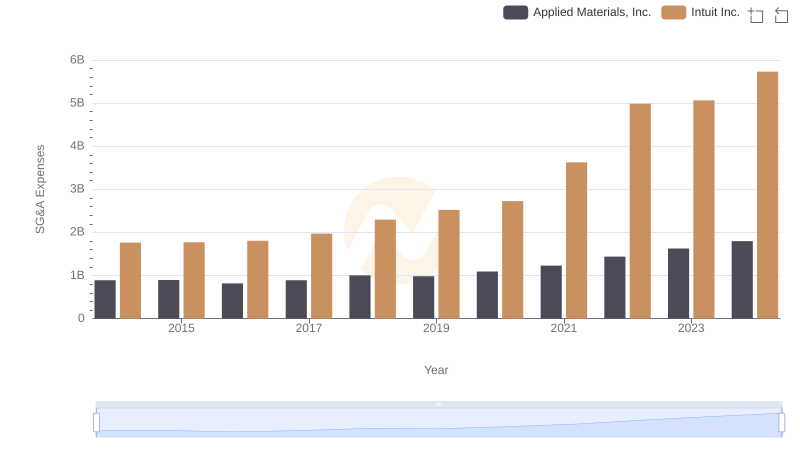
Intuit Inc. and Applied Materials, Inc.: SG&A Spending Patterns Compared
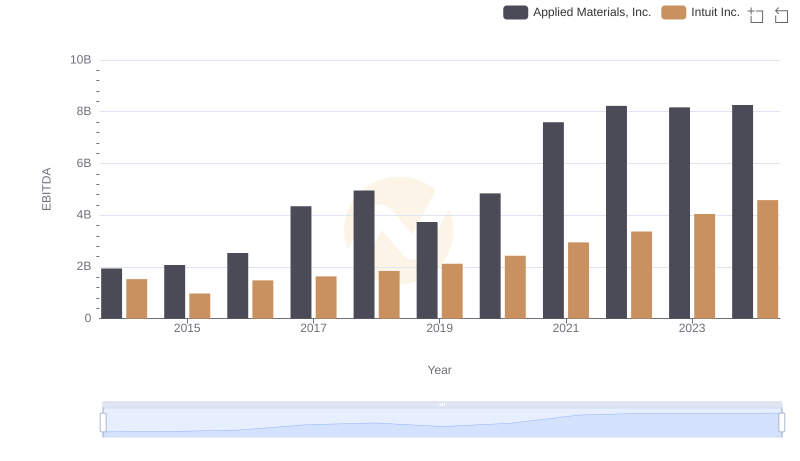
EBITDA Performance Review: Intuit Inc. vs Applied Materials, Inc.