| __timestamp | Intuit Inc. | Palo Alto Networks, Inc. |
|---|---|---|
| Wednesday, January 1, 2014 | 1762000000 | 407912000 |
| Thursday, January 1, 2015 | 1771000000 | 624261000 |
| Friday, January 1, 2016 | 1807000000 | 914400000 |
| Sunday, January 1, 2017 | 1973000000 | 1117400000 |
| Monday, January 1, 2018 | 2298000000 | 1356200000 |
| Tuesday, January 1, 2019 | 2524000000 | 1605800000 |
| Wednesday, January 1, 2020 | 2727000000 | 1819800000 |
| Friday, January 1, 2021 | 3626000000 | 2144900000 |
| Saturday, January 1, 2022 | 4986000000 | 2553900000 |
| Sunday, January 1, 2023 | 5062000000 | 2991700000 |
| Monday, January 1, 2024 | 5730000000 | 3475000000 |
Unlocking the unknown
In the ever-evolving landscape of corporate finance, understanding the trends in Selling, General, and Administrative (SG&A) expenses is crucial for investors and analysts alike. Over the past decade, Intuit Inc. and Palo Alto Networks, Inc. have showcased distinct trajectories in their SG&A expenditures.
From 2014 to 2024, Intuit Inc. has seen a remarkable increase of over 225% in its SG&A expenses, reflecting its aggressive growth and expansion strategies. In contrast, Palo Alto Networks, Inc. has experienced a substantial rise of approximately 750%, indicating its rapid scaling in the cybersecurity sector.
These trends not only highlight the companies' strategic priorities but also offer insights into their operational efficiencies and market positioning. As we move forward, monitoring these expenses will be key to understanding their future financial health and competitive edge.
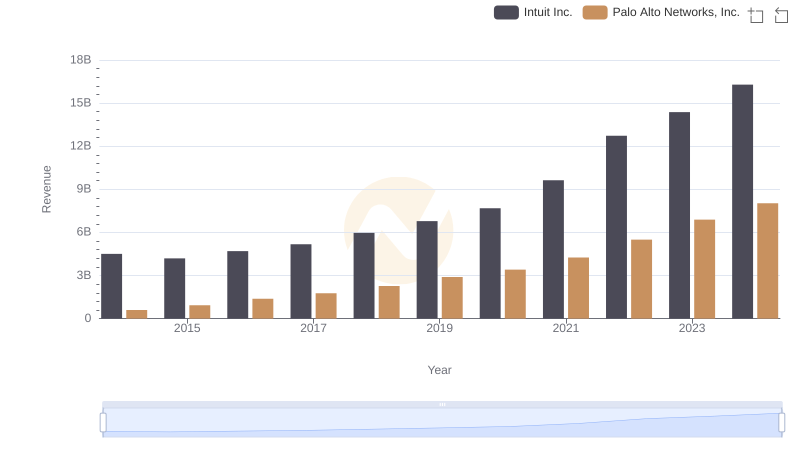
Breaking Down Revenue Trends: Intuit Inc. vs Palo Alto Networks, Inc.
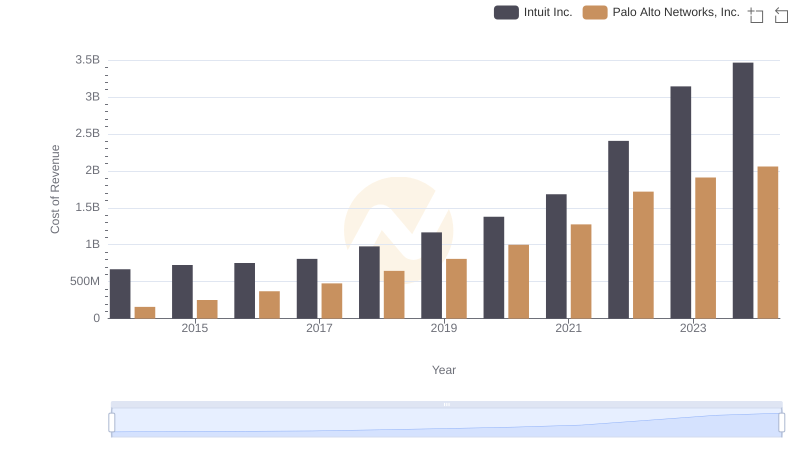
Cost Insights: Breaking Down Intuit Inc. and Palo Alto Networks, Inc.'s Expenses
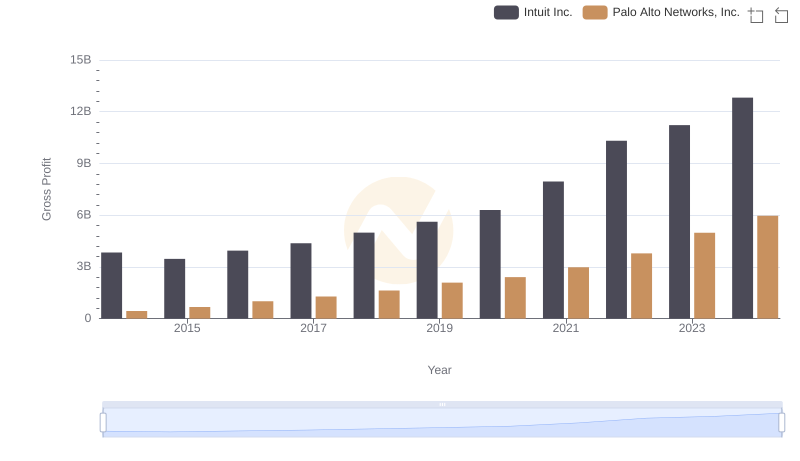
Who Generates Higher Gross Profit? Intuit Inc. or Palo Alto Networks, Inc.
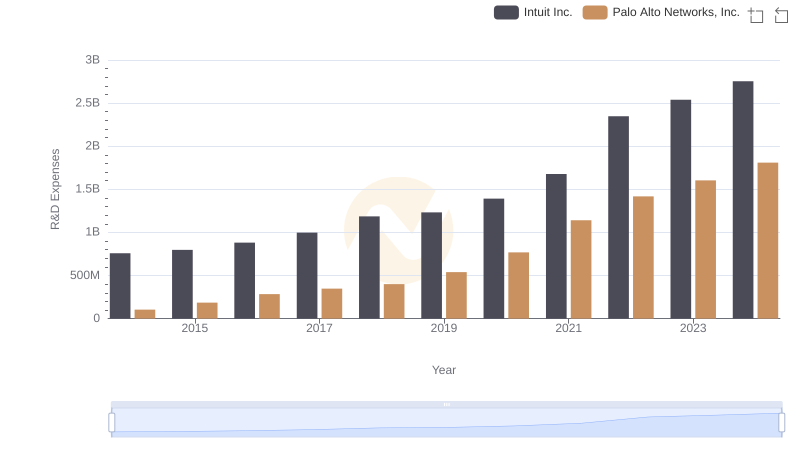
Comparing Innovation Spending: Intuit Inc. and Palo Alto Networks, Inc.
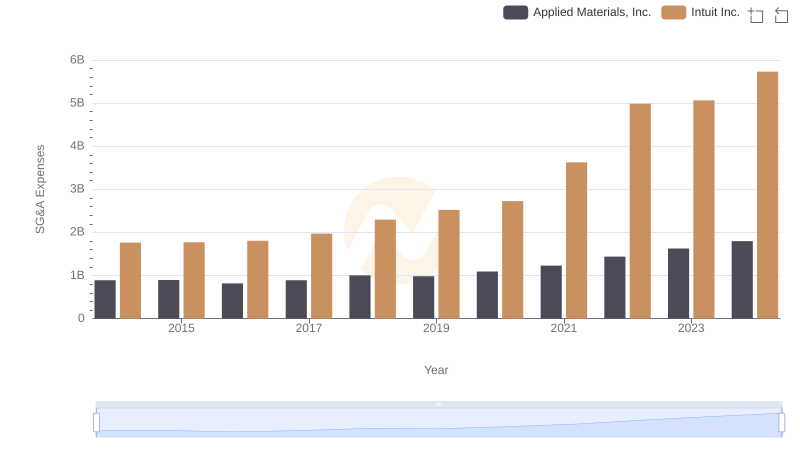
Intuit Inc. and Applied Materials, Inc.: SG&A Spending Patterns Compared
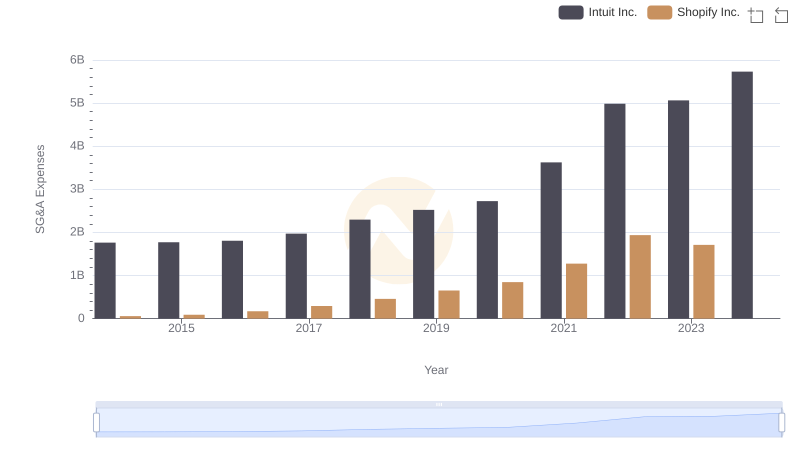
Who Optimizes SG&A Costs Better? Intuit Inc. or Shopify Inc.

Cost Management Insights: SG&A Expenses for Intuit Inc. and Fiserv, Inc.
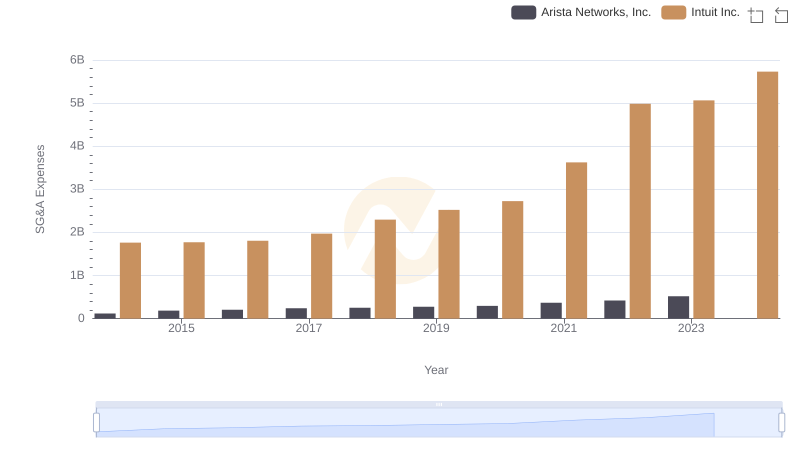
Operational Costs Compared: SG&A Analysis of Intuit Inc. and Arista Networks, Inc.
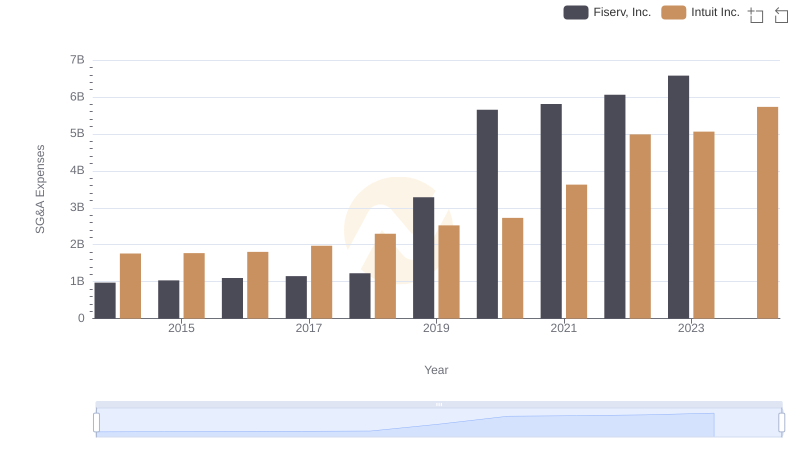
Intuit Inc. or Fiserv, Inc.: Who Manages SG&A Costs Better?
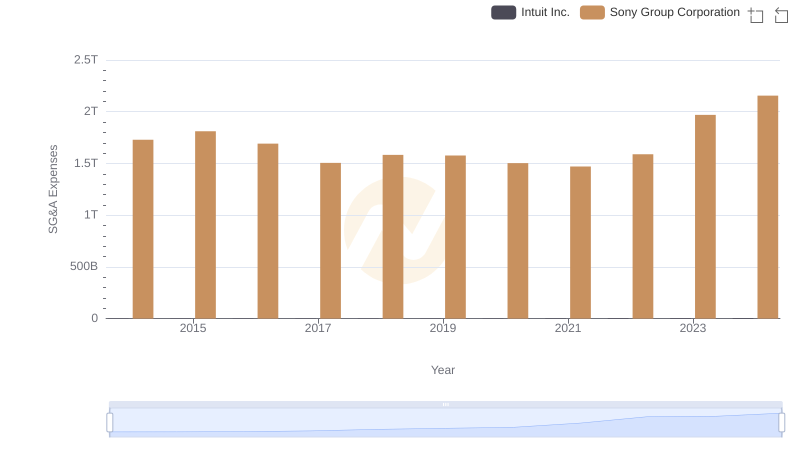
Who Optimizes SG&A Costs Better? Intuit Inc. or Sony Group Corporation
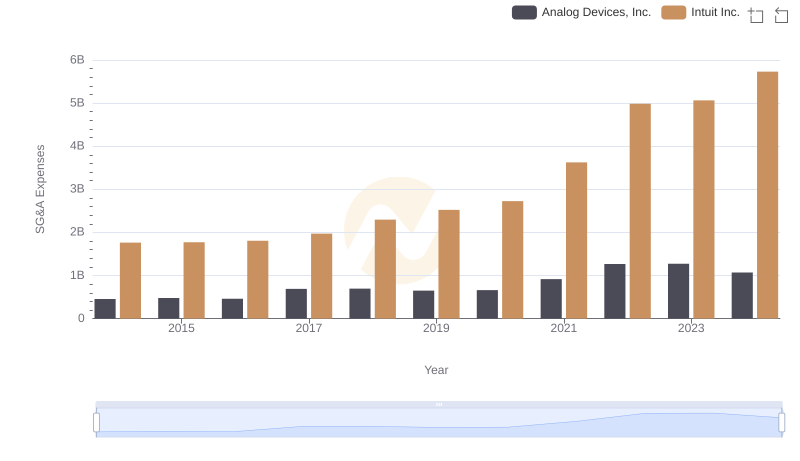
Who Optimizes SG&A Costs Better? Intuit Inc. or Analog Devices, Inc.
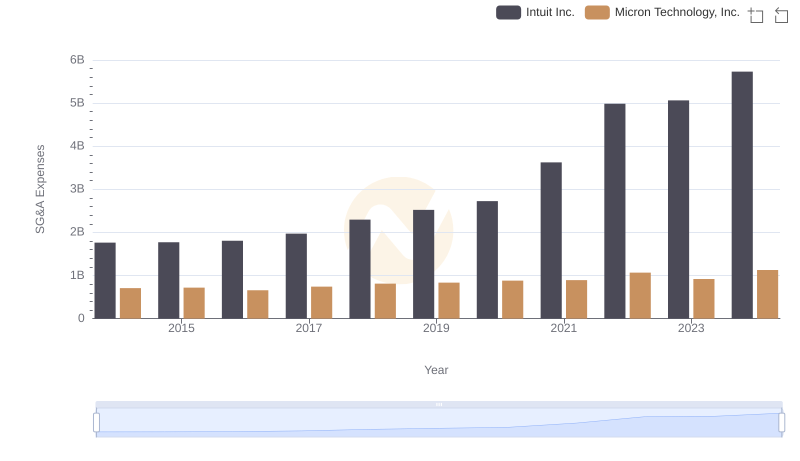
Who Optimizes SG&A Costs Better? Intuit Inc. or Micron Technology, Inc.