| __timestamp | Applied Materials, Inc. | Intuit Inc. |
|---|---|---|
| Wednesday, January 1, 2014 | 3843000000 | 3838000000 |
| Thursday, January 1, 2015 | 3952000000 | 3467000000 |
| Friday, January 1, 2016 | 4511000000 | 3942000000 |
| Sunday, January 1, 2017 | 6532000000 | 4368000000 |
| Monday, January 1, 2018 | 7817000000 | 4987000000 |
| Tuesday, January 1, 2019 | 6386000000 | 5617000000 |
| Wednesday, January 1, 2020 | 7692000000 | 6301000000 |
| Friday, January 1, 2021 | 10914000000 | 7950000000 |
| Saturday, January 1, 2022 | 11993000000 | 10320000000 |
| Sunday, January 1, 2023 | 12384000000 | 11225000000 |
| Monday, January 1, 2024 | 12897000000 | 12820000000 |
Unveiling the hidden dimensions of data
In the ever-evolving landscape of technology and finance, Intuit Inc. and Applied Materials, Inc. have emerged as titans, each carving a unique path to success. Over the past decade, these companies have demonstrated remarkable growth in gross profit, a key indicator of financial health and operational efficiency.
From 2014 to 2024, Applied Materials, Inc. has seen its gross profit soar by approximately 235%, reflecting its robust position in the semiconductor industry. Meanwhile, Intuit Inc., a leader in financial software, has achieved an impressive 234% increase in the same period. Notably, both companies experienced significant growth spurts in 2021, with Applied Materials, Inc. achieving a 42% increase and Intuit Inc. a 26% rise compared to the previous year.
This analysis underscores the dynamic nature of these industries and the strategic prowess of these companies in navigating market challenges.
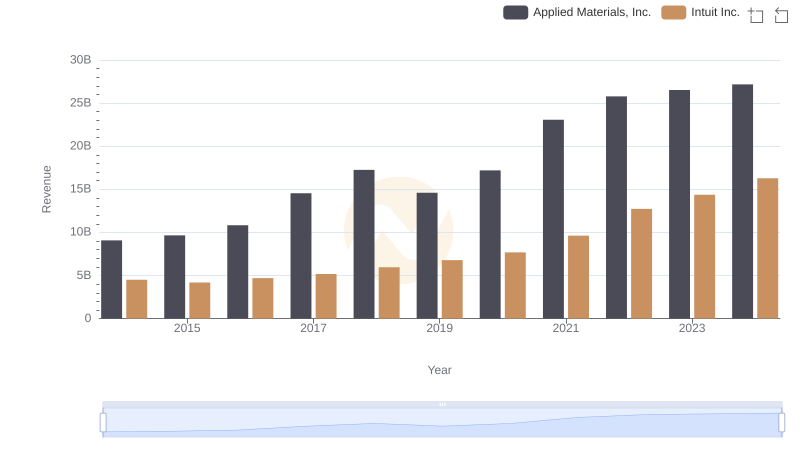
Revenue Insights: Intuit Inc. and Applied Materials, Inc. Performance Compared
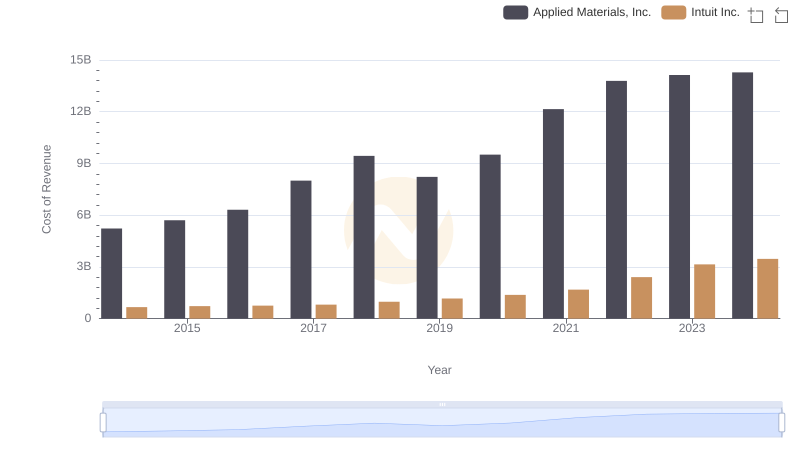
Cost of Revenue Comparison: Intuit Inc. vs Applied Materials, Inc.
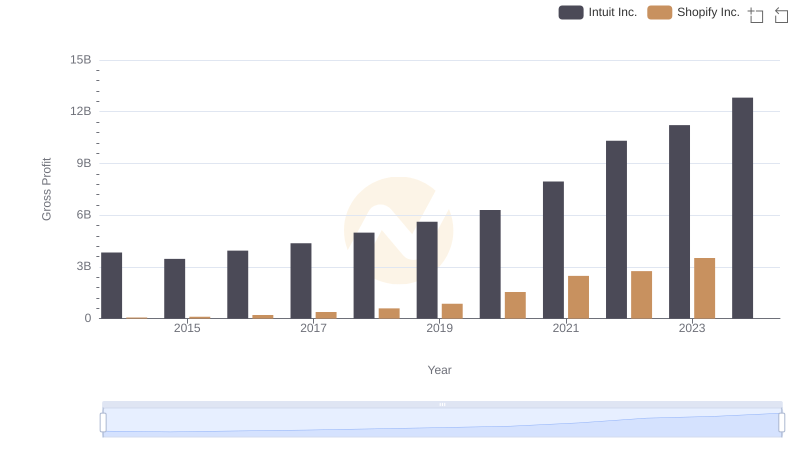
Gross Profit Comparison: Intuit Inc. and Shopify Inc. Trends
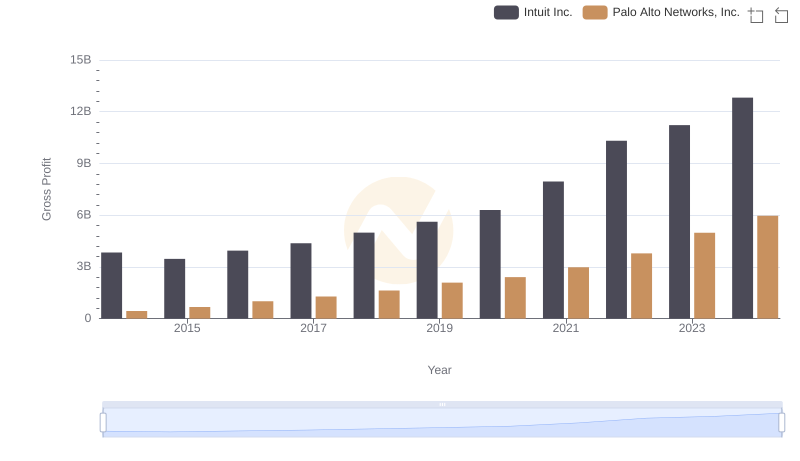
Who Generates Higher Gross Profit? Intuit Inc. or Palo Alto Networks, Inc.
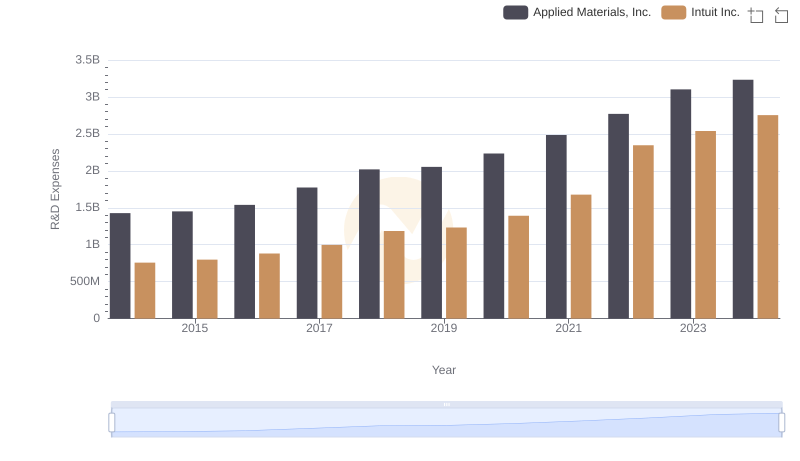
Research and Development Expenses Breakdown: Intuit Inc. vs Applied Materials, Inc.
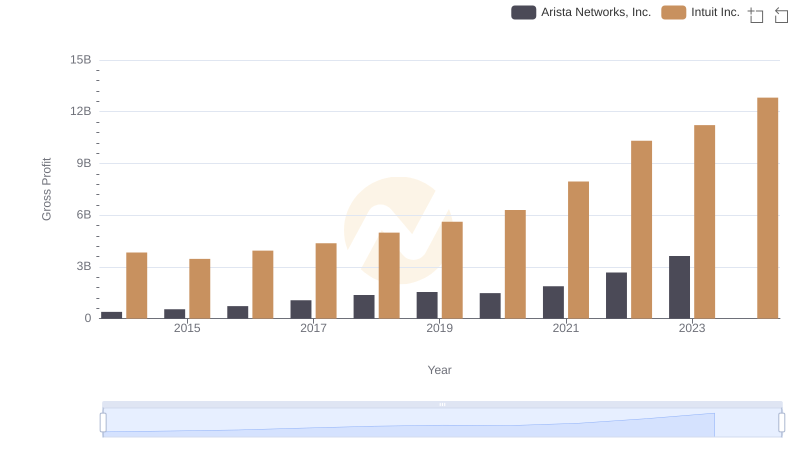
Intuit Inc. vs Arista Networks, Inc.: A Gross Profit Performance Breakdown
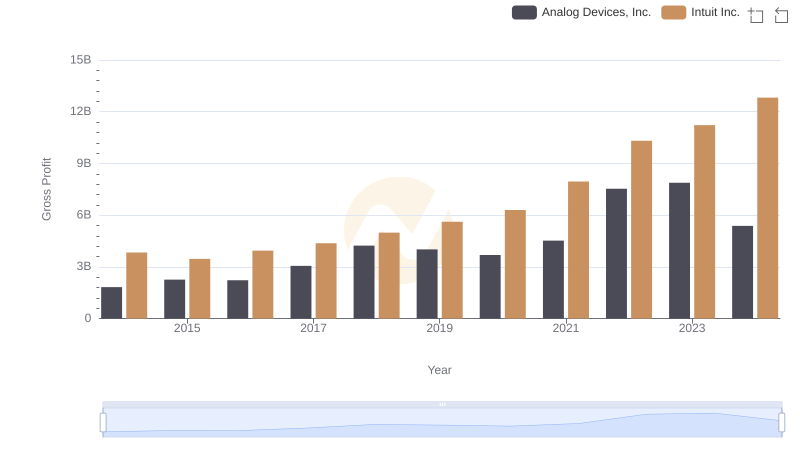
Who Generates Higher Gross Profit? Intuit Inc. or Analog Devices, Inc.
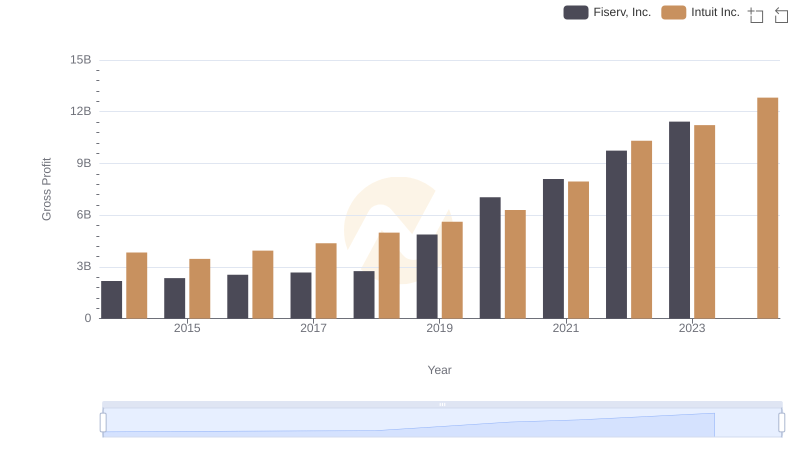
Who Generates Higher Gross Profit? Intuit Inc. or Fiserv, Inc.
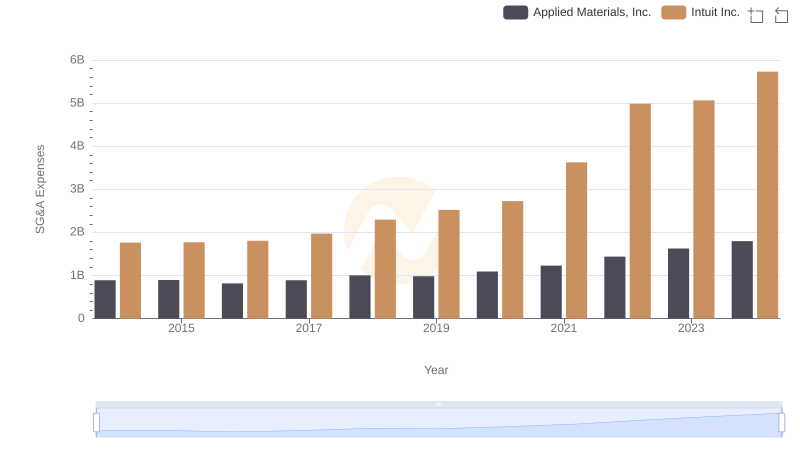
Intuit Inc. and Applied Materials, Inc.: SG&A Spending Patterns Compared
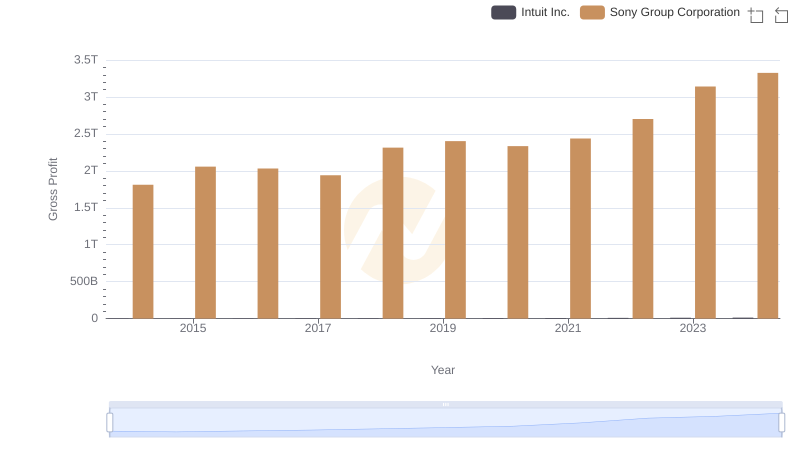
Gross Profit Analysis: Comparing Intuit Inc. and Sony Group Corporation

Intuit Inc. vs Fiserv, Inc.: A Gross Profit Performance Breakdown
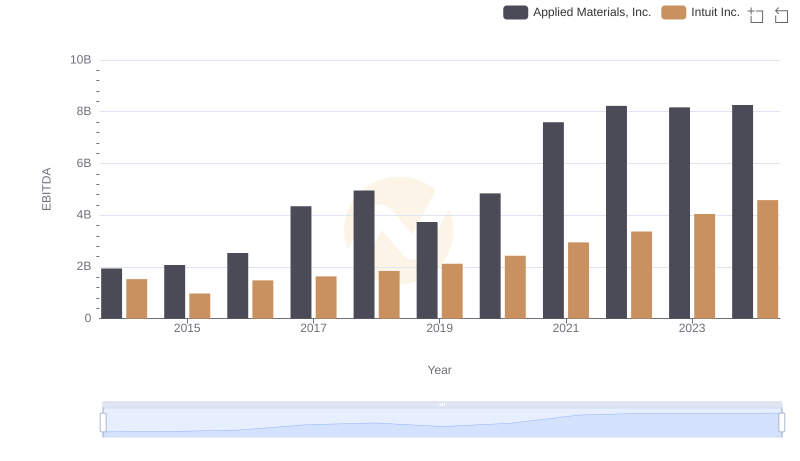
EBITDA Performance Review: Intuit Inc. vs Applied Materials, Inc.