| __timestamp | Fiserv, Inc. | Intuit Inc. |
|---|---|---|
| Wednesday, January 1, 2014 | 975000000 | 1762000000 |
| Thursday, January 1, 2015 | 1034000000 | 1771000000 |
| Friday, January 1, 2016 | 1101000000 | 1807000000 |
| Sunday, January 1, 2017 | 1150000000 | 1973000000 |
| Monday, January 1, 2018 | 1228000000 | 2298000000 |
| Tuesday, January 1, 2019 | 3284000000 | 2524000000 |
| Wednesday, January 1, 2020 | 5652000000 | 2727000000 |
| Friday, January 1, 2021 | 5810000000 | 3626000000 |
| Saturday, January 1, 2022 | 6059000000 | 4986000000 |
| Sunday, January 1, 2023 | 6576000000 | 5062000000 |
| Monday, January 1, 2024 | 6564000000 | 5730000000 |
Igniting the spark of knowledge
In the ever-evolving landscape of financial technology, understanding cost management is crucial. Over the past decade, Intuit Inc. and Fiserv, Inc. have demonstrated distinct trajectories in their Selling, General, and Administrative (SG&A) expenses. From 2014 to 2023, Fiserv's SG&A expenses surged by over 570%, peaking in 2023. In contrast, Intuit's expenses grew by approximately 187% during the same period, reflecting a more measured approach. Notably, 2019 marked a pivotal year for Fiserv, with expenses more than doubling, likely due to strategic investments. Meanwhile, Intuit's steady increase suggests a focus on sustainable growth. The data for 2024 is incomplete, highlighting the dynamic nature of financial forecasting. As these industry giants continue to innovate, their cost management strategies will be pivotal in shaping their competitive edge.
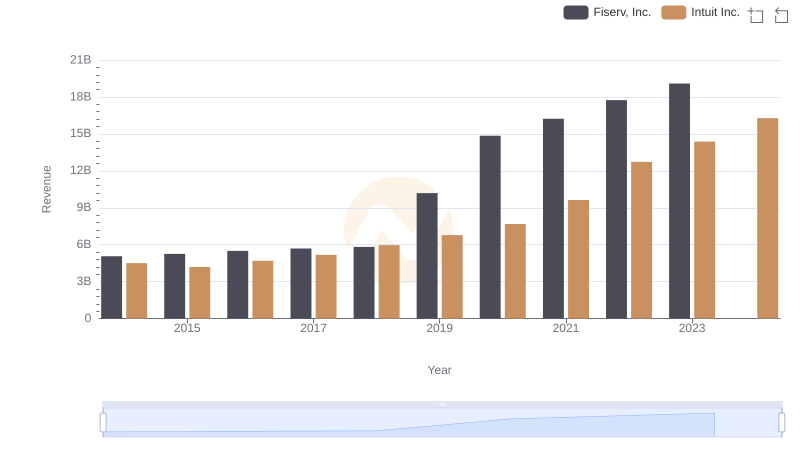
Comparing Revenue Performance: Intuit Inc. or Fiserv, Inc.?

Annual Revenue Comparison: Intuit Inc. vs Fiserv, Inc.
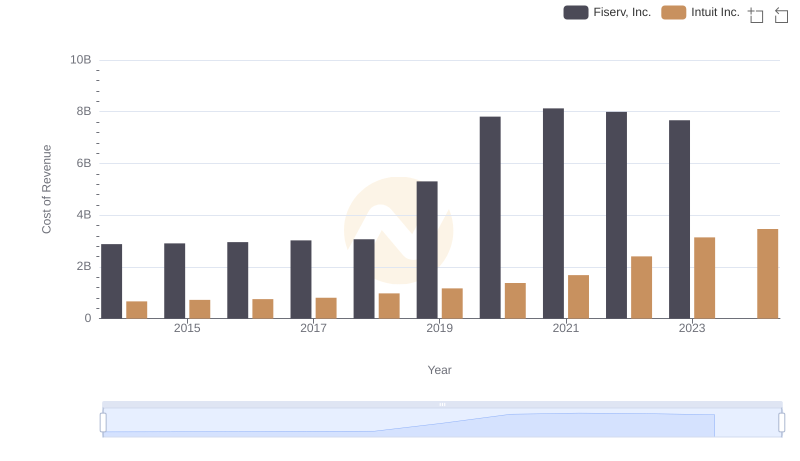
Cost Insights: Breaking Down Intuit Inc. and Fiserv, Inc.'s Expenses

Cost Insights: Breaking Down Intuit Inc. and Fiserv, Inc.'s Expenses
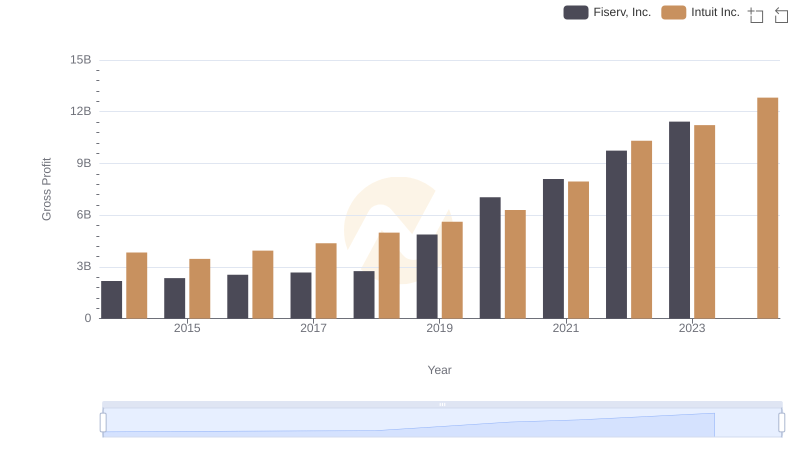
Who Generates Higher Gross Profit? Intuit Inc. or Fiserv, Inc.

Intuit Inc. vs Fiserv, Inc.: A Gross Profit Performance Breakdown
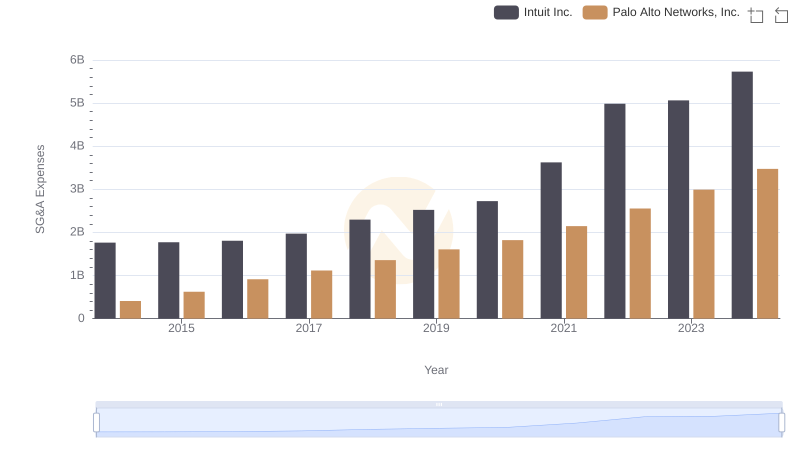
Comparing SG&A Expenses: Intuit Inc. vs Palo Alto Networks, Inc. Trends and Insights
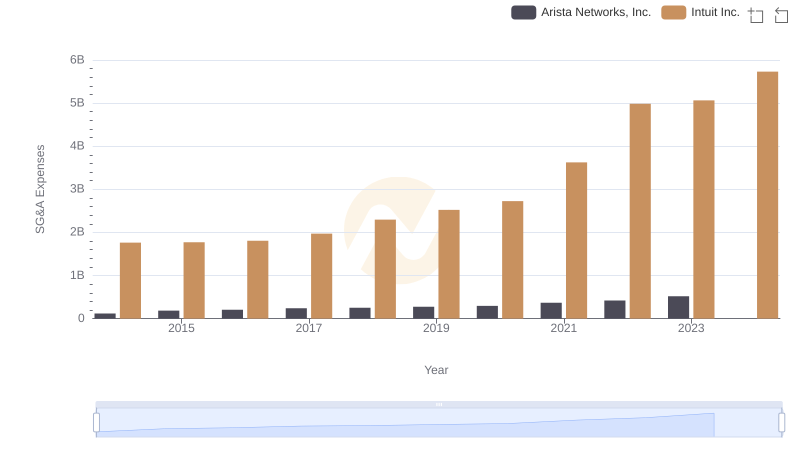
Operational Costs Compared: SG&A Analysis of Intuit Inc. and Arista Networks, Inc.
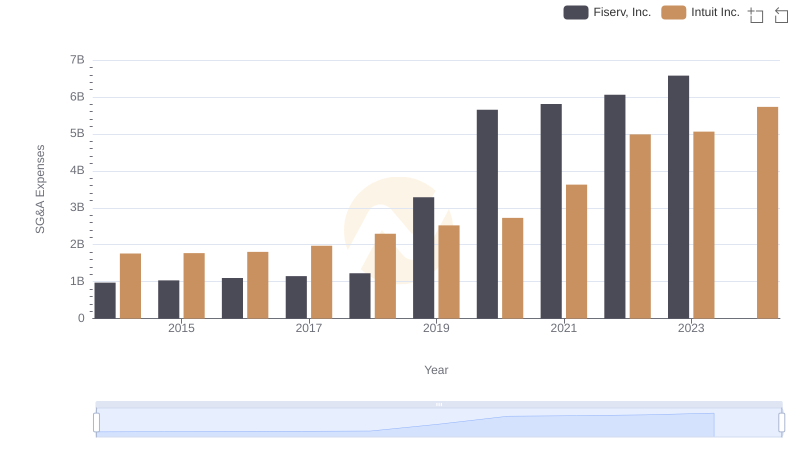
Intuit Inc. or Fiserv, Inc.: Who Manages SG&A Costs Better?
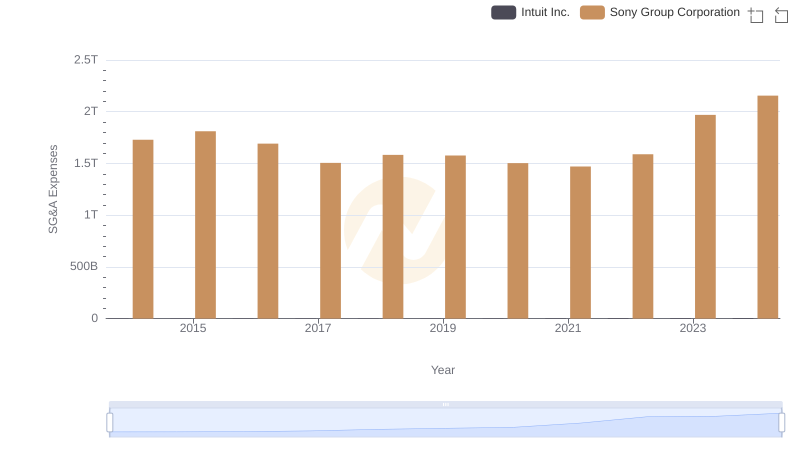
Who Optimizes SG&A Costs Better? Intuit Inc. or Sony Group Corporation
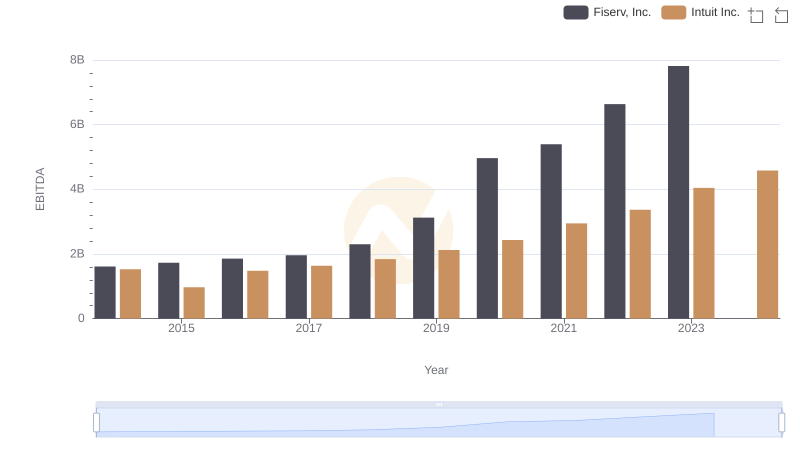
Comprehensive EBITDA Comparison: Intuit Inc. vs Fiserv, Inc.

Comprehensive EBITDA Comparison: Intuit Inc. vs Fiserv, Inc.