| __timestamp | Applied Materials, Inc. | Intuit Inc. |
|---|---|---|
| Wednesday, January 1, 2014 | 1939000000 | 1528000000 |
| Thursday, January 1, 2015 | 2074000000 | 970000000 |
| Friday, January 1, 2016 | 2539000000 | 1480000000 |
| Sunday, January 1, 2017 | 4343000000 | 1634000000 |
| Monday, January 1, 2018 | 4953000000 | 1839000000 |
| Tuesday, January 1, 2019 | 3735000000 | 2121000000 |
| Wednesday, January 1, 2020 | 4844000000 | 2430000000 |
| Friday, January 1, 2021 | 7594000000 | 2948000000 |
| Saturday, January 1, 2022 | 8228000000 | 3369000000 |
| Sunday, January 1, 2023 | 8169000000 | 4043000000 |
| Monday, January 1, 2024 | 8259000000 | 4581000000 |
Unleashing insights
In the ever-evolving landscape of technology and finance, two giants, Intuit Inc. and Applied Materials, Inc., have showcased remarkable EBITDA growth over the past decade. From 2014 to 2024, Applied Materials, Inc. has seen its EBITDA surge by over 326%, peaking in 2024. This growth reflects its strategic advancements in semiconductor technology, crucial for the digital age. Meanwhile, Intuit Inc., a leader in financial software, has experienced a robust 200% increase in EBITDA, highlighting its expanding influence in the fintech sector.
This data underscores the dynamic growth trajectories of these industry leaders, reflecting broader trends in technology and finance.
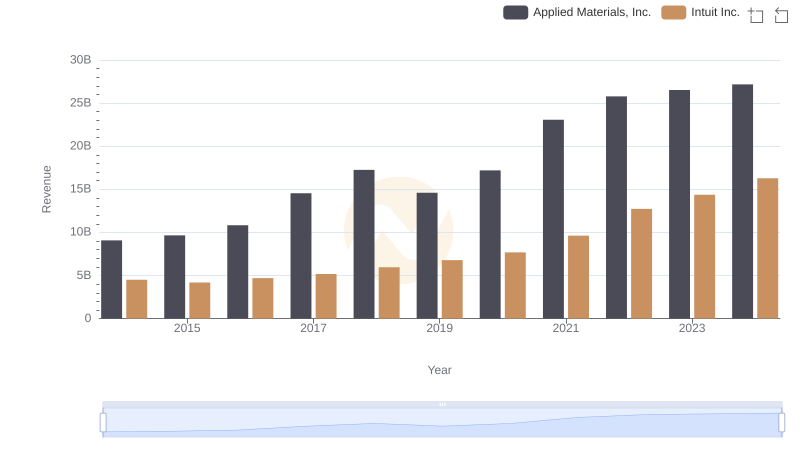
Revenue Insights: Intuit Inc. and Applied Materials, Inc. Performance Compared
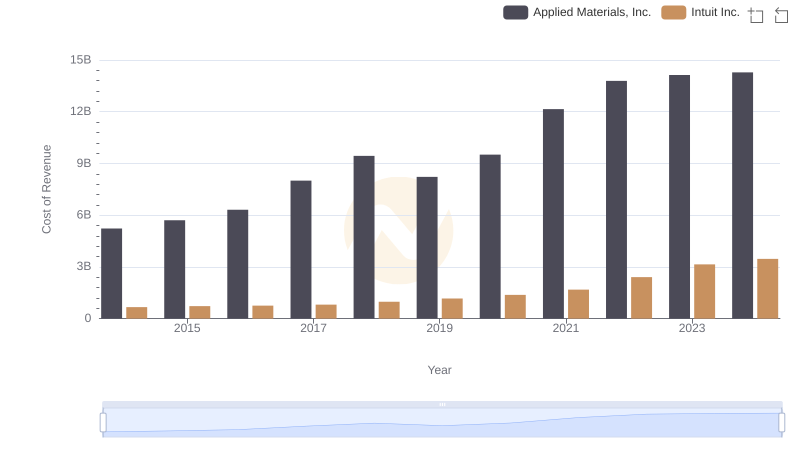
Cost of Revenue Comparison: Intuit Inc. vs Applied Materials, Inc.
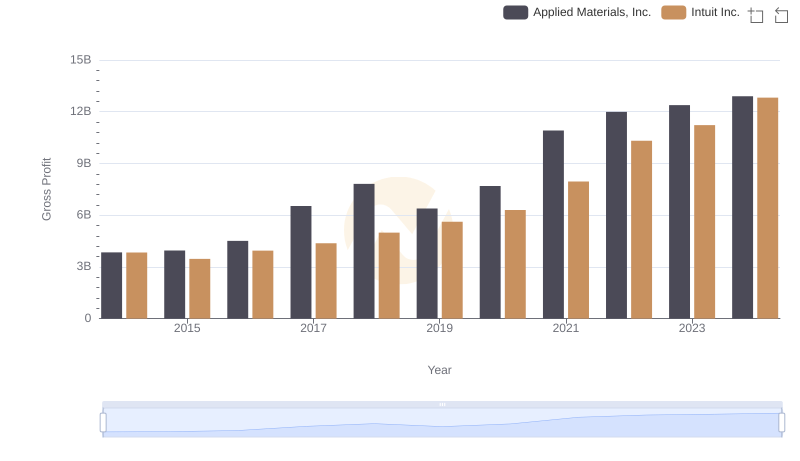
Intuit Inc. and Applied Materials, Inc.: A Detailed Gross Profit Analysis
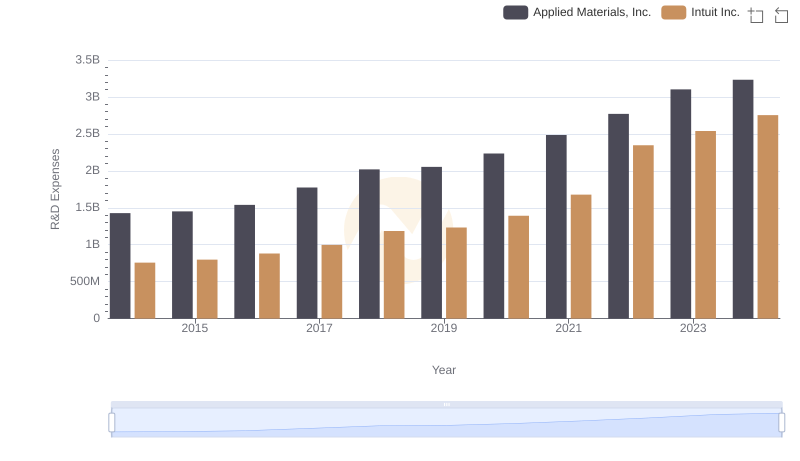
Research and Development Expenses Breakdown: Intuit Inc. vs Applied Materials, Inc.
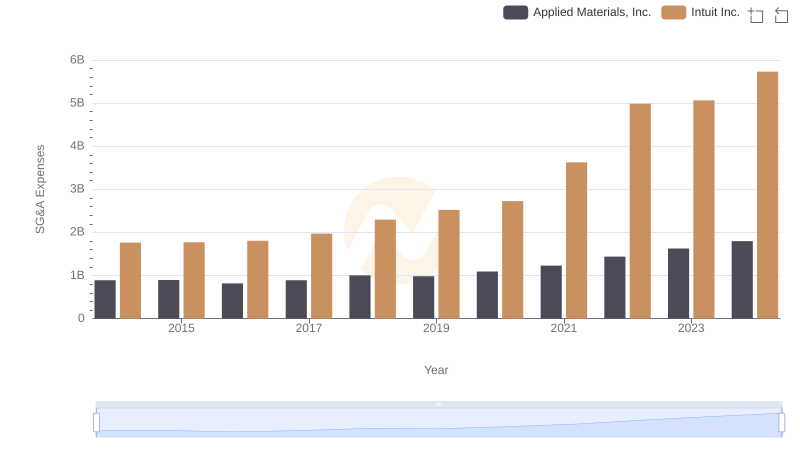
Intuit Inc. and Applied Materials, Inc.: SG&A Spending Patterns Compared
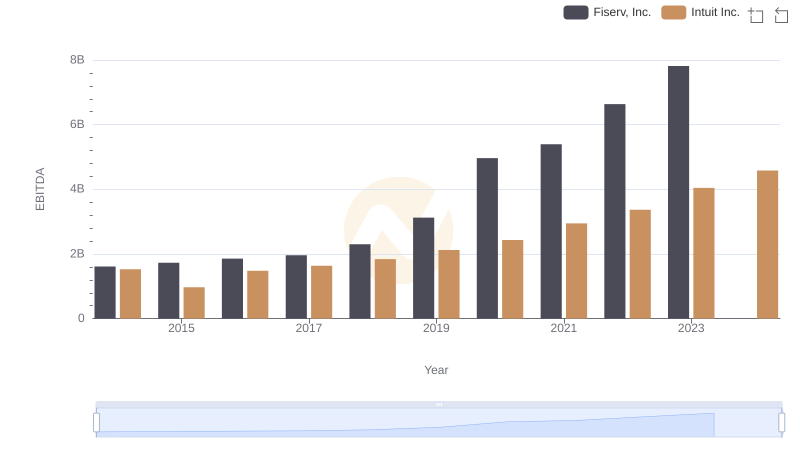
Comprehensive EBITDA Comparison: Intuit Inc. vs Fiserv, Inc.
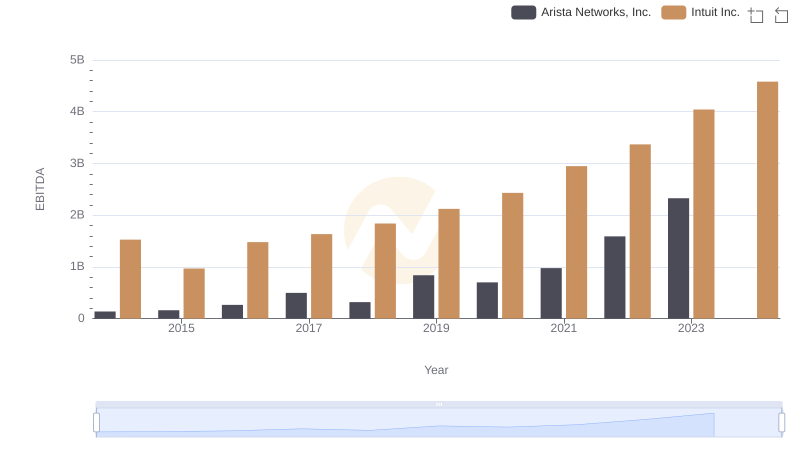
Intuit Inc. and Arista Networks, Inc.: A Detailed Examination of EBITDA Performance

Comprehensive EBITDA Comparison: Intuit Inc. vs Fiserv, Inc.
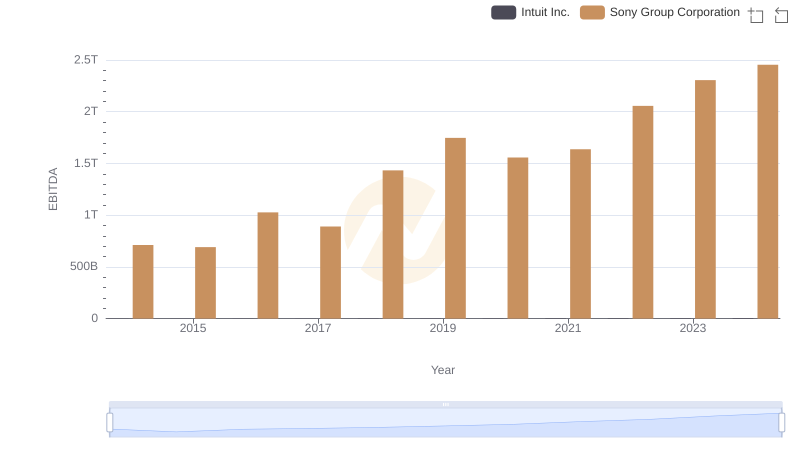
EBITDA Performance Review: Intuit Inc. vs Sony Group Corporation
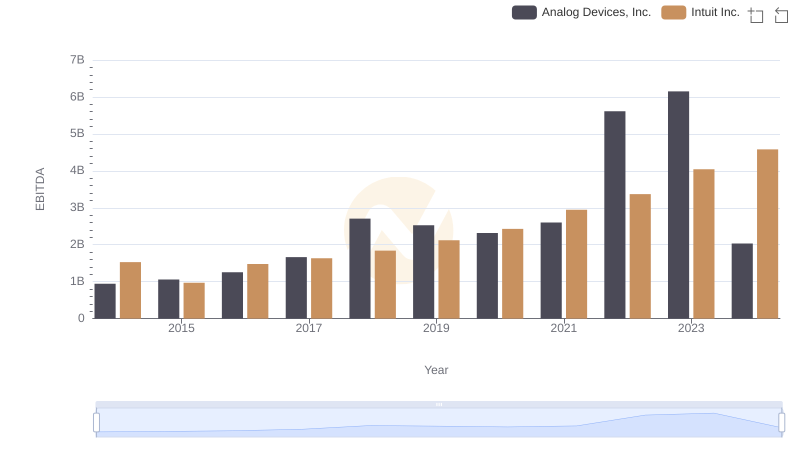
A Side-by-Side Analysis of EBITDA: Intuit Inc. and Analog Devices, Inc.
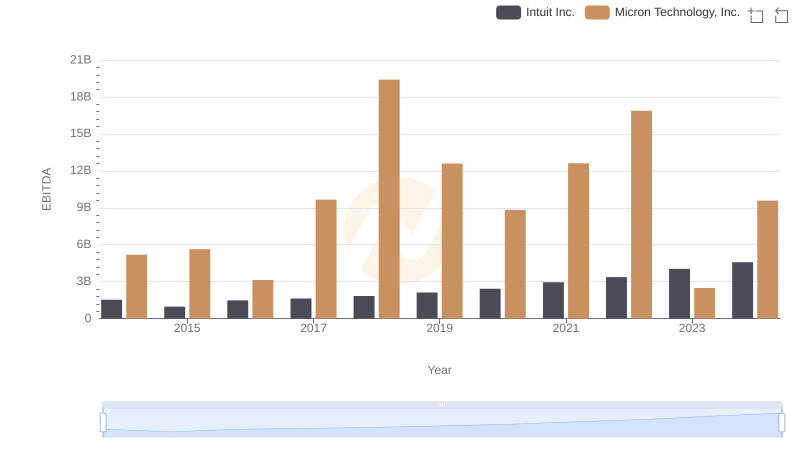
A Side-by-Side Analysis of EBITDA: Intuit Inc. and Micron Technology, Inc.
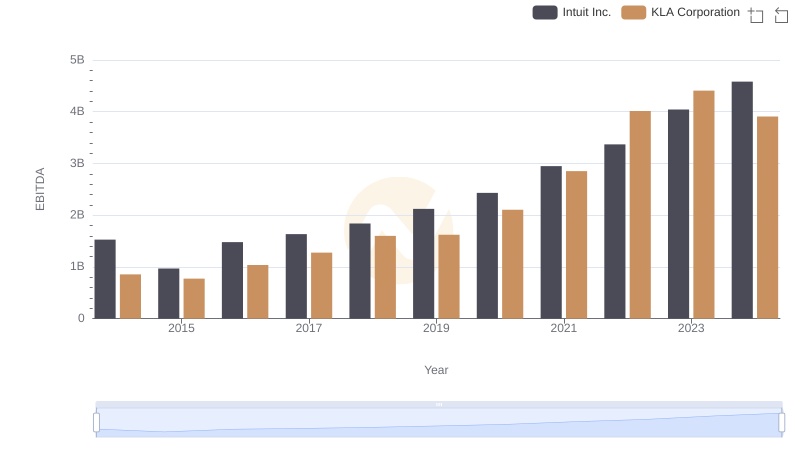
Intuit Inc. vs KLA Corporation: In-Depth EBITDA Performance Comparison