| __timestamp | Applied Materials, Inc. | Intuit Inc. |
|---|---|---|
| Wednesday, January 1, 2014 | 9072000000 | 4506000000 |
| Thursday, January 1, 2015 | 9659000000 | 4192000000 |
| Friday, January 1, 2016 | 10825000000 | 4694000000 |
| Sunday, January 1, 2017 | 14537000000 | 5177000000 |
| Monday, January 1, 2018 | 17253000000 | 5964000000 |
| Tuesday, January 1, 2019 | 14608000000 | 6784000000 |
| Wednesday, January 1, 2020 | 17202000000 | 7679000000 |
| Friday, January 1, 2021 | 23063000000 | 9633000000 |
| Saturday, January 1, 2022 | 25785000000 | 12726000000 |
| Sunday, January 1, 2023 | 26517000000 | 14368000000 |
| Monday, January 1, 2024 | 27176000000 | 16285000000 |
Unleashing insights
In the ever-evolving landscape of technology, Intuit Inc. and Applied Materials, Inc. have showcased remarkable revenue trajectories over the past decade. From 2014 to 2024, Applied Materials, Inc. has seen its revenue nearly triple, growing from approximately $9 billion to over $27 billion. This represents a robust annual growth rate, highlighting its dominance in the semiconductor industry.
On the other hand, Intuit Inc., a leader in financial software, has also demonstrated impressive growth. Starting at around $4.5 billion in 2014, its revenue has surged to approximately $16 billion by 2024, marking a significant increase of over 250%. This growth underscores Intuit's strategic expansion and innovation in financial solutions.
Both companies have navigated the challenges of the past decade with resilience, adapting to market demands and technological advancements. Their revenue growth is a testament to their strategic foresight and operational excellence.
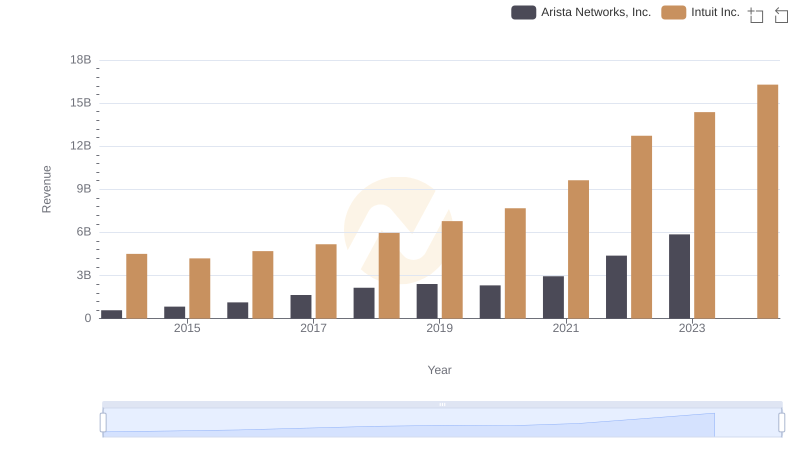
Annual Revenue Comparison: Intuit Inc. vs Arista Networks, Inc.
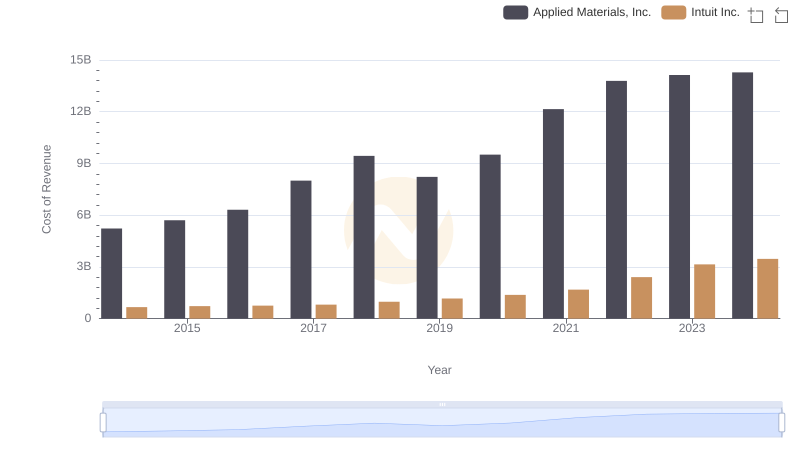
Cost of Revenue Comparison: Intuit Inc. vs Applied Materials, Inc.
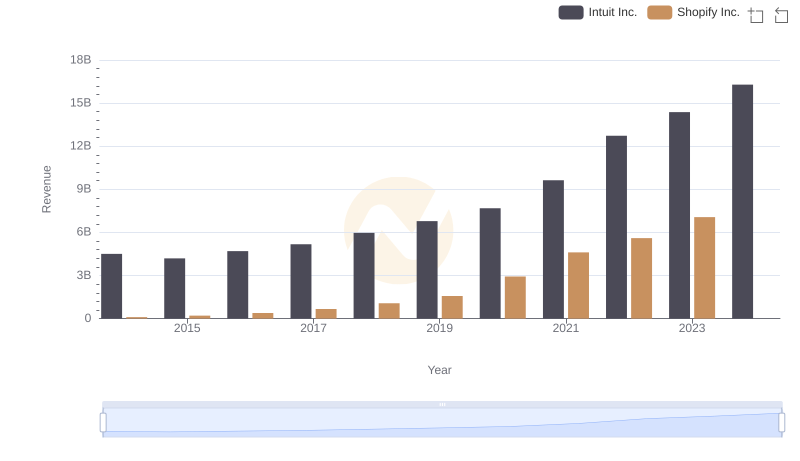
Breaking Down Revenue Trends: Intuit Inc. vs Shopify Inc.
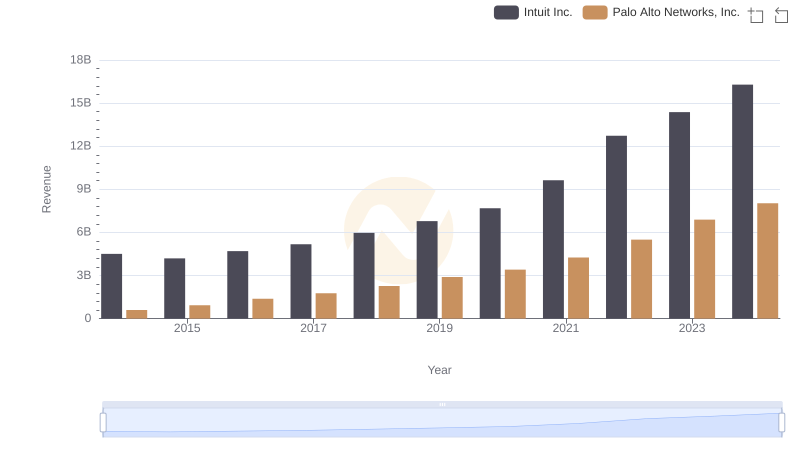
Breaking Down Revenue Trends: Intuit Inc. vs Palo Alto Networks, Inc.
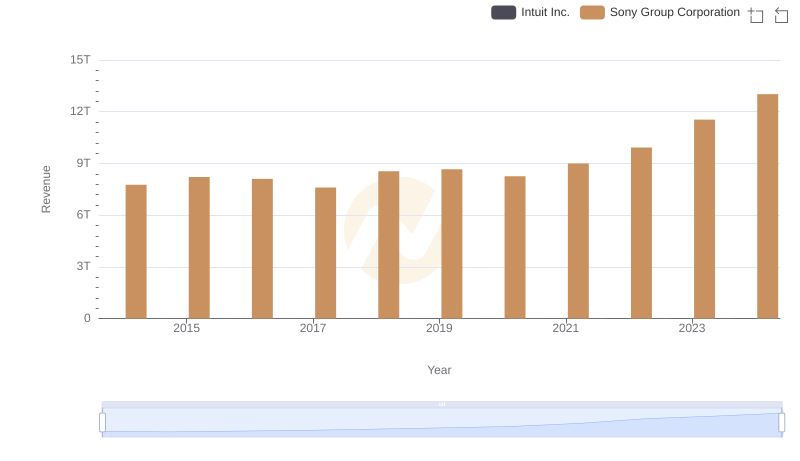
Annual Revenue Comparison: Intuit Inc. vs Sony Group Corporation
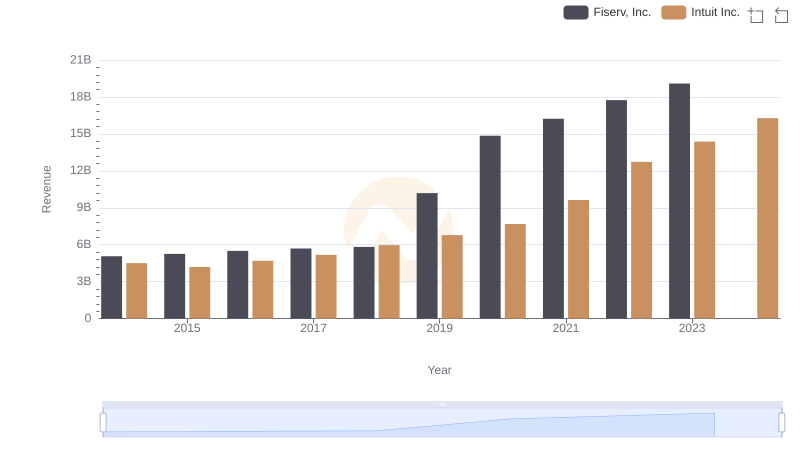
Comparing Revenue Performance: Intuit Inc. or Fiserv, Inc.?
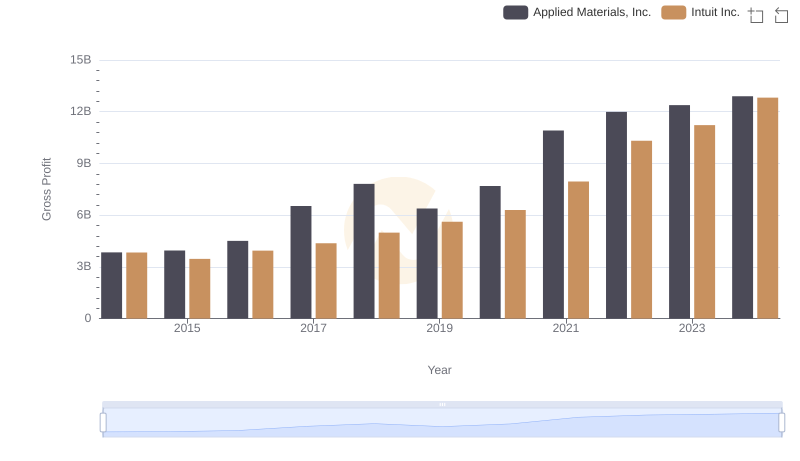
Intuit Inc. and Applied Materials, Inc.: A Detailed Gross Profit Analysis

Annual Revenue Comparison: Intuit Inc. vs Fiserv, Inc.
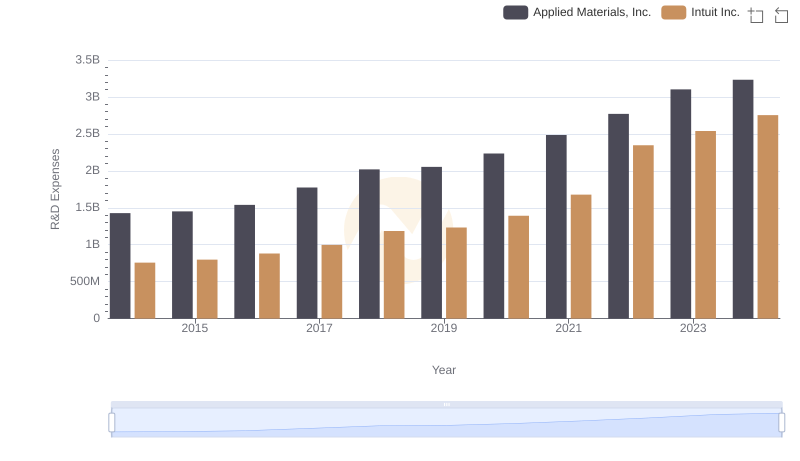
Research and Development Expenses Breakdown: Intuit Inc. vs Applied Materials, Inc.
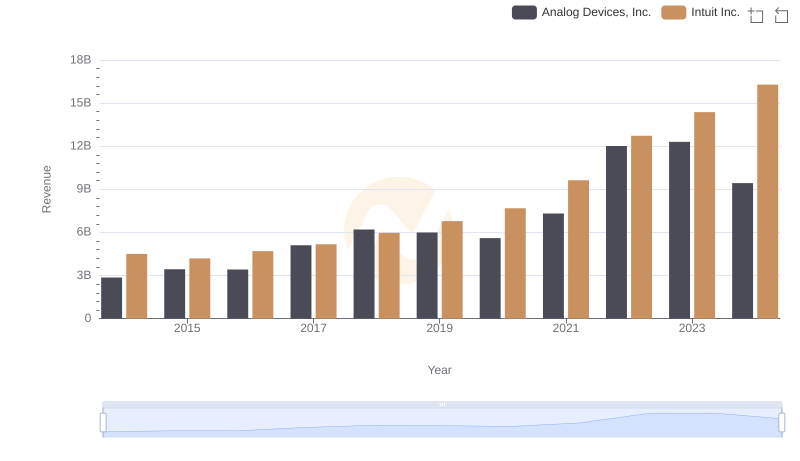
Who Generates More Revenue? Intuit Inc. or Analog Devices, Inc.
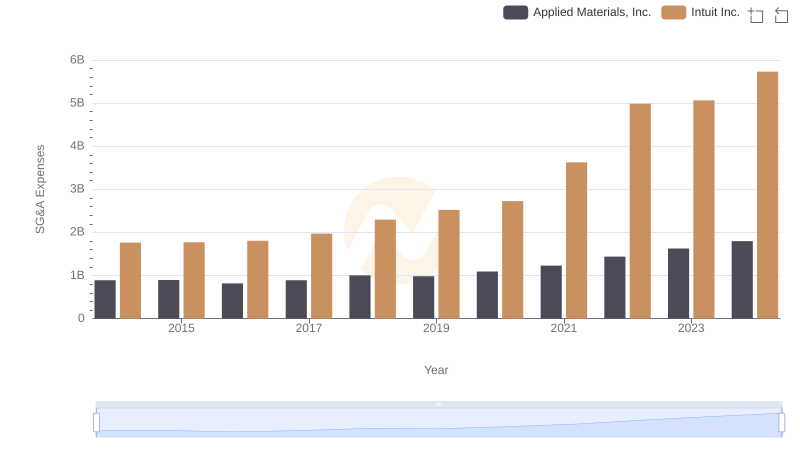
Intuit Inc. and Applied Materials, Inc.: SG&A Spending Patterns Compared
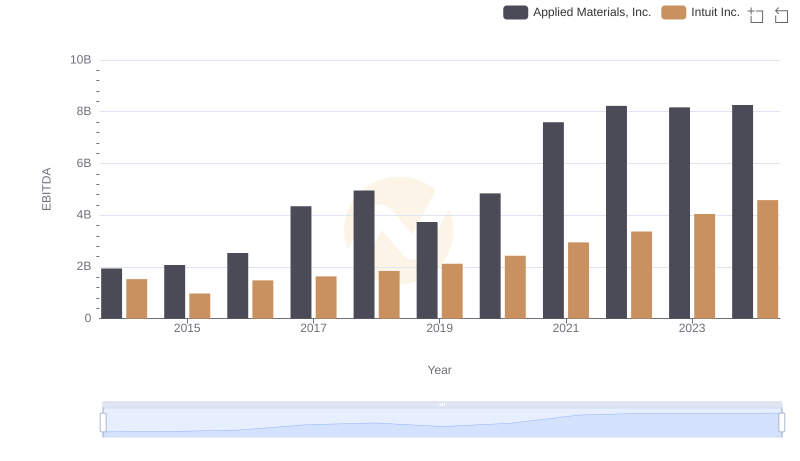
EBITDA Performance Review: Intuit Inc. vs Applied Materials, Inc.