| __timestamp | Lennox International Inc. | TransUnion |
|---|---|---|
| Wednesday, January 1, 2014 | 3367400000 | 1304700000 |
| Thursday, January 1, 2015 | 3467400000 | 1506800000 |
| Friday, January 1, 2016 | 3641600000 | 1704900000 |
| Sunday, January 1, 2017 | 3839600000 | 1933800000 |
| Monday, January 1, 2018 | 3883900000 | 2317200000 |
| Tuesday, January 1, 2019 | 3807200000 | 2656100000 |
| Wednesday, January 1, 2020 | 3634100000 | 2716600000 |
| Friday, January 1, 2021 | 4194100000 | 2960200000 |
| Saturday, January 1, 2022 | 4718400000 | 3709900000 |
| Sunday, January 1, 2023 | 4981900000 | 3831200000 |
| Monday, January 1, 2024 | 5341300000 | 4183800000 |
Unleashing the power of data
In the ever-evolving landscape of the American corporate world, Lennox International Inc. and TransUnion have emerged as key players in their respective industries. Over the past decade, Lennox International Inc., a leader in climate control solutions, has seen its revenue grow by approximately 59%, from $3.37 billion in 2014 to an impressive $5.34 billion in 2024. This growth underscores the company's robust market strategy and adaptability in a competitive environment.
Meanwhile, TransUnion, a global information and insights company, has also demonstrated significant revenue growth, with a 193% increase from $1.30 billion in 2014 to $3.83 billion in 2023. This surge highlights the increasing demand for data-driven insights in the digital age. However, data for 2024 is currently unavailable, leaving room for speculation on future trends.
Both companies exemplify resilience and innovation, setting benchmarks in their industries and offering valuable insights into the dynamics of revenue growth.
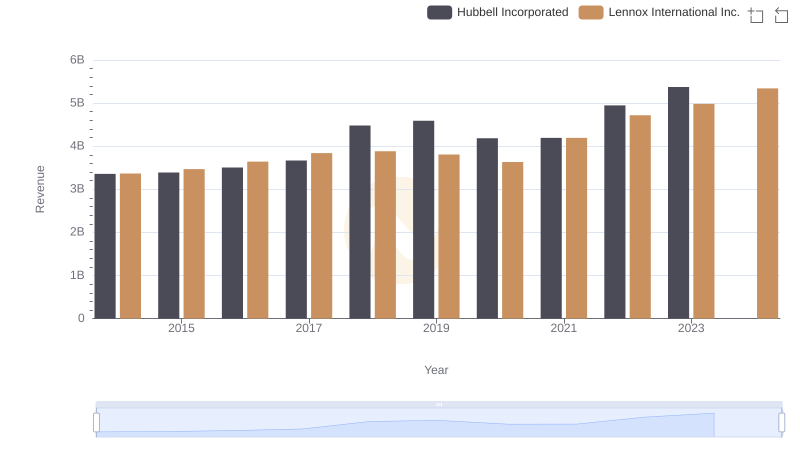
Revenue Showdown: Lennox International Inc. vs Hubbell Incorporated
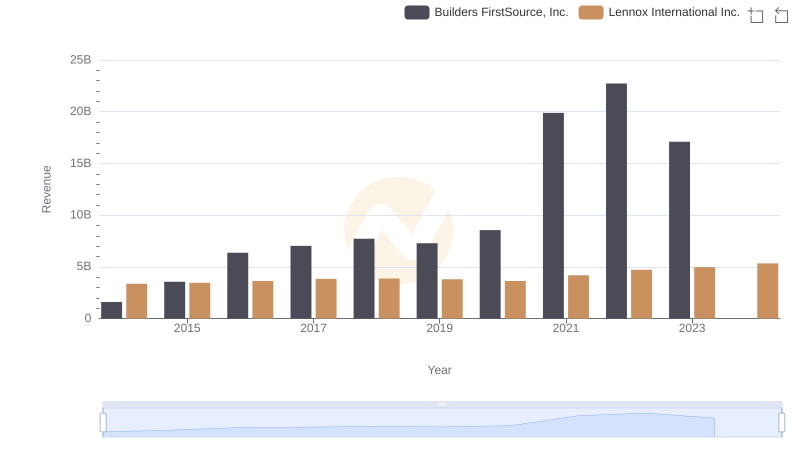
Lennox International Inc. and Builders FirstSource, Inc.: A Comprehensive Revenue Analysis
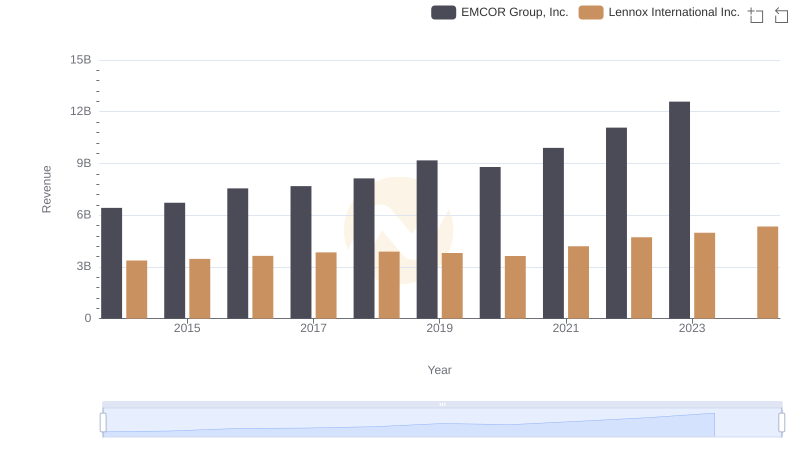
Who Generates More Revenue? Lennox International Inc. or EMCOR Group, Inc.
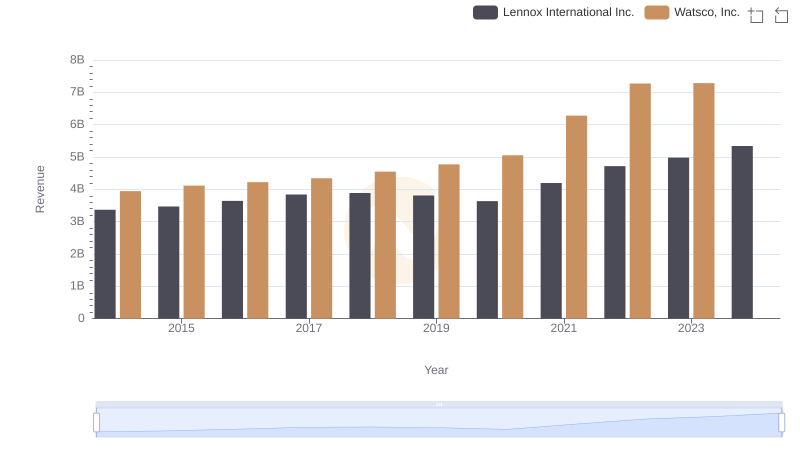
Comparing Revenue Performance: Lennox International Inc. or Watsco, Inc.?
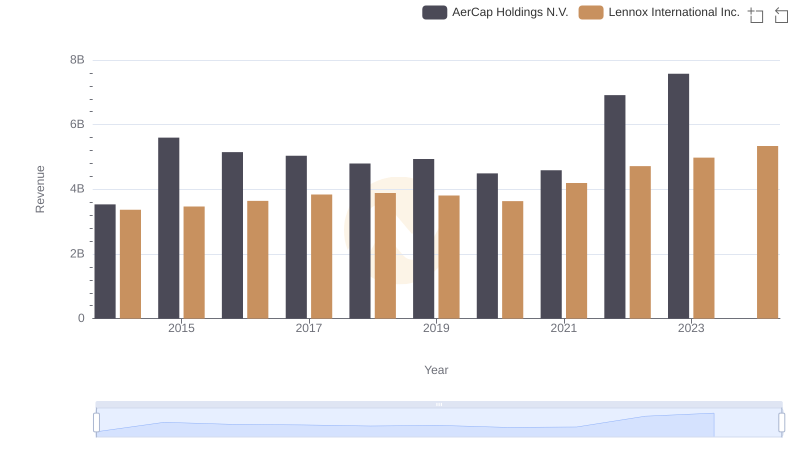
Annual Revenue Comparison: Lennox International Inc. vs AerCap Holdings N.V.
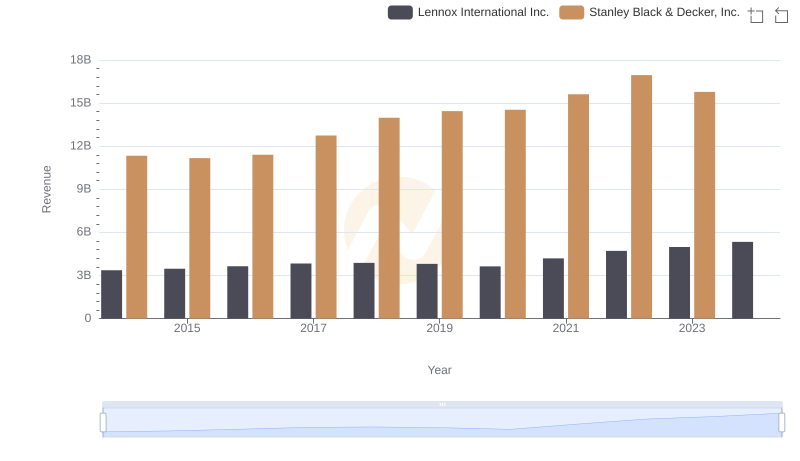
Lennox International Inc. vs Stanley Black & Decker, Inc.: Annual Revenue Growth Compared
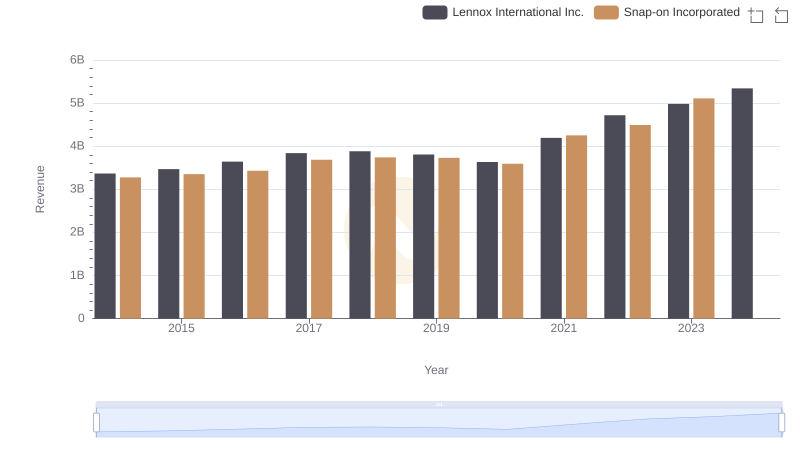
Lennox International Inc. vs Snap-on Incorporated: Examining Key Revenue Metrics
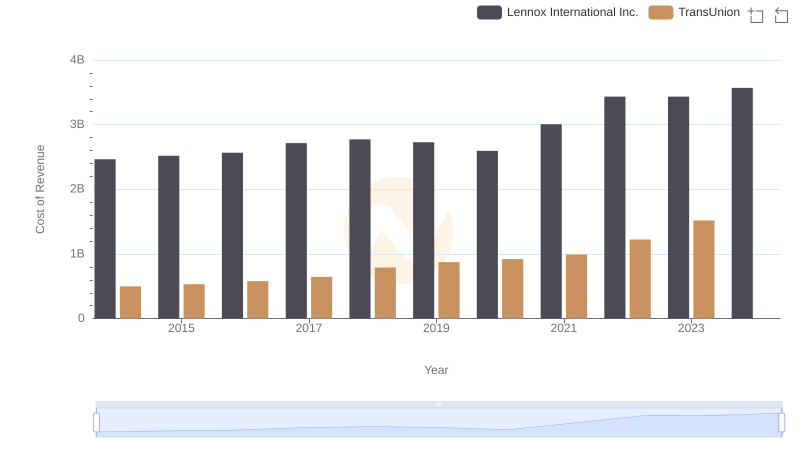
Comparing Cost of Revenue Efficiency: Lennox International Inc. vs TransUnion
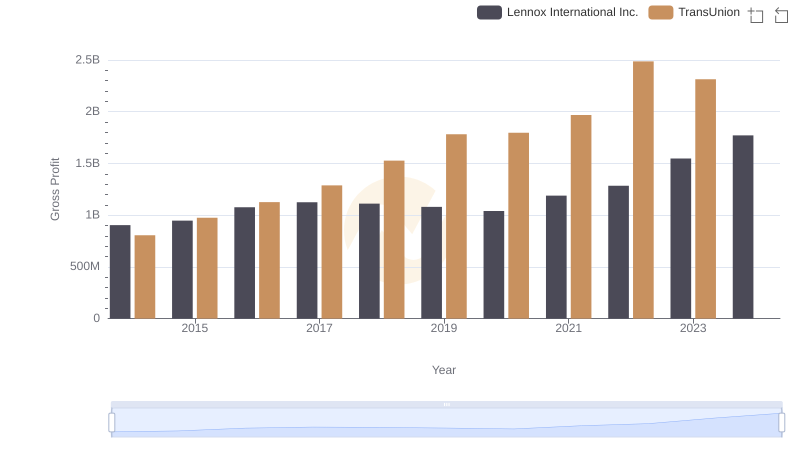
Gross Profit Trends Compared: Lennox International Inc. vs TransUnion
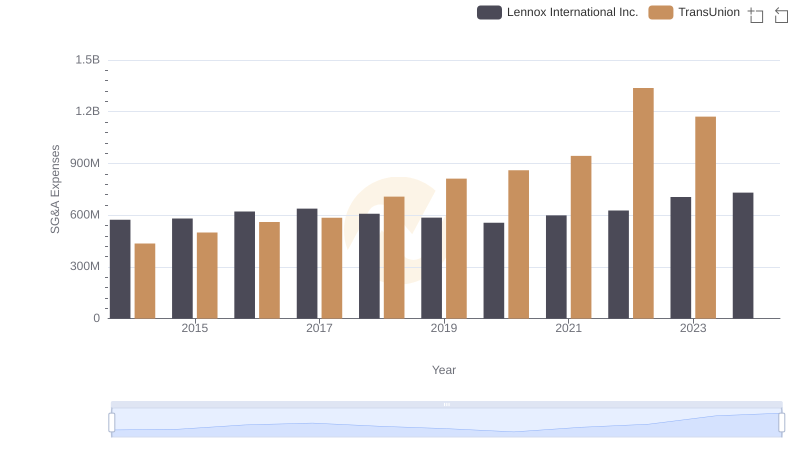
SG&A Efficiency Analysis: Comparing Lennox International Inc. and TransUnion
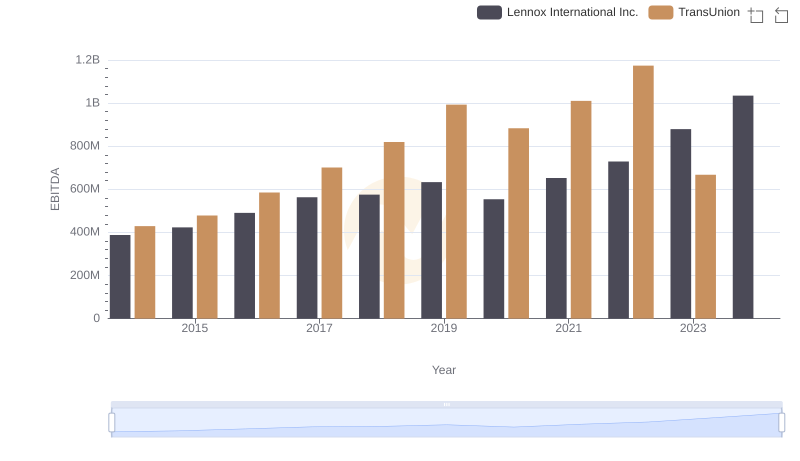
EBITDA Performance Review: Lennox International Inc. vs TransUnion