| __timestamp | Lennox International Inc. | TransUnion |
|---|---|---|
| Wednesday, January 1, 2014 | 2464100000 | 499100000 |
| Thursday, January 1, 2015 | 2520000000 | 531600000 |
| Friday, January 1, 2016 | 2565100000 | 579100000 |
| Sunday, January 1, 2017 | 2714400000 | 645700000 |
| Monday, January 1, 2018 | 2772700000 | 790100000 |
| Tuesday, January 1, 2019 | 2727400000 | 874100000 |
| Wednesday, January 1, 2020 | 2594000000 | 920400000 |
| Friday, January 1, 2021 | 3005700000 | 991600000 |
| Saturday, January 1, 2022 | 3433700000 | 1222900000 |
| Sunday, January 1, 2023 | 3434100000 | 1517300000 |
| Monday, January 1, 2024 | 3569400000 | 0 |
Infusing magic into the data realm
In the competitive landscape of American business, understanding cost efficiency is crucial. Lennox International Inc. and TransUnion, two giants in their respective industries, offer a fascinating study in contrasts. From 2014 to 2023, Lennox International Inc. consistently demonstrated robust cost management, with their cost of revenue increasing by approximately 40% over the decade. In contrast, TransUnion's cost of revenue surged by over 200% during the same period, reflecting a more aggressive growth strategy.
Lennox's steady climb, peaking at $3.57 billion in 2024, underscores their commitment to operational efficiency. Meanwhile, TransUnion's rapid rise to $1.52 billion in 2023, despite missing data for 2024, highlights their dynamic expansion in the financial services sector. This comparison not only sheds light on their financial strategies but also offers valuable insights for investors and industry analysts alike.
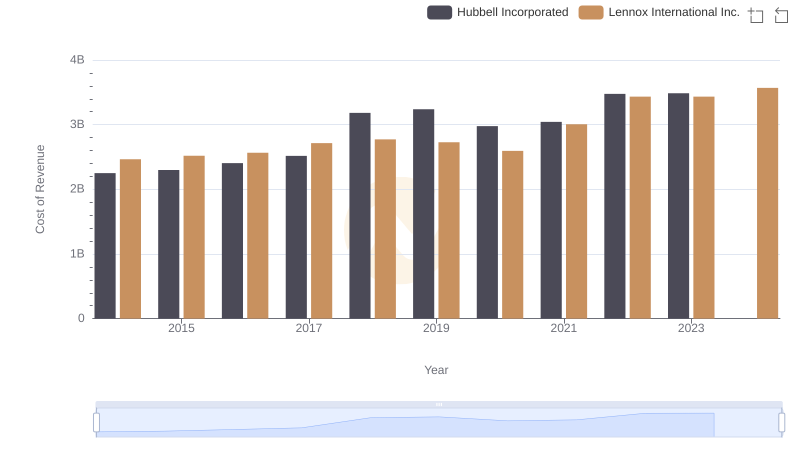
Cost of Revenue Comparison: Lennox International Inc. vs Hubbell Incorporated
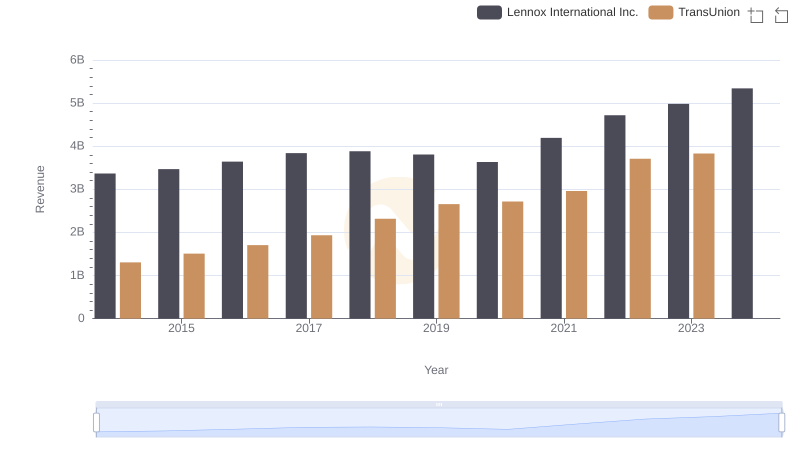
Lennox International Inc. vs TransUnion: Examining Key Revenue Metrics
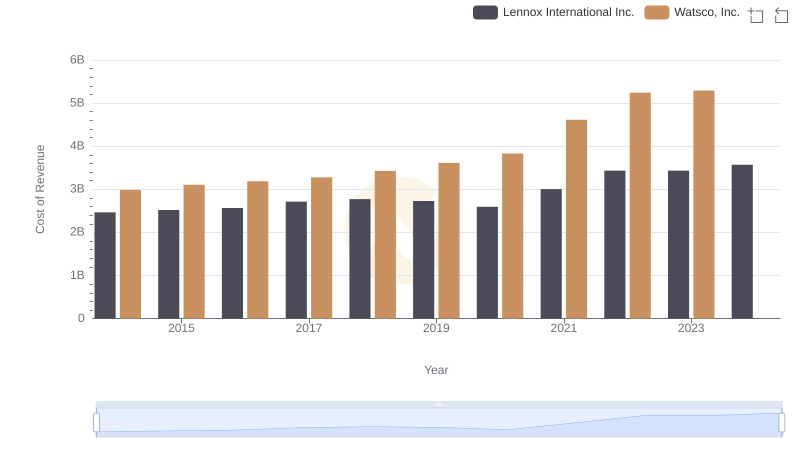
Cost of Revenue Trends: Lennox International Inc. vs Watsco, Inc.
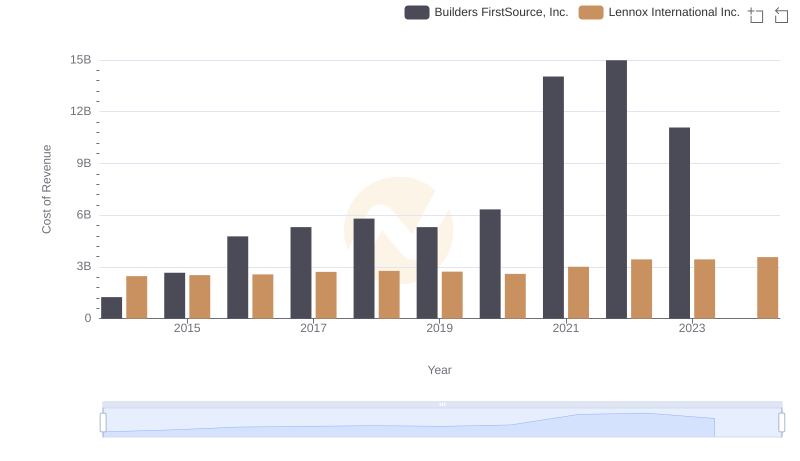
Cost Insights: Breaking Down Lennox International Inc. and Builders FirstSource, Inc.'s Expenses
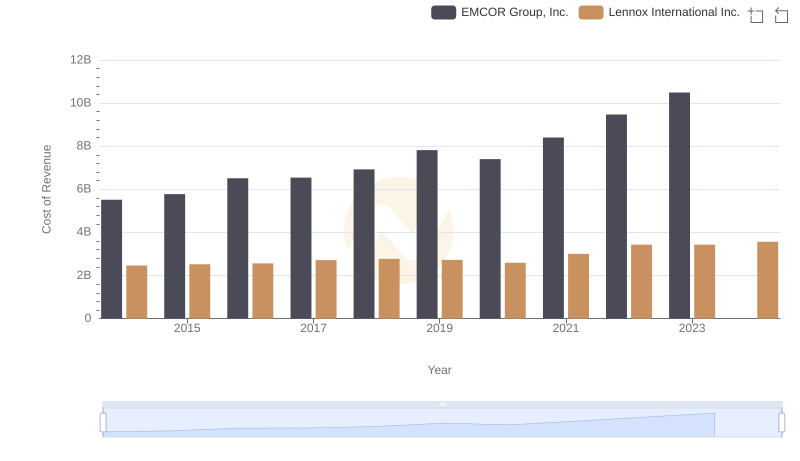
Comparing Cost of Revenue Efficiency: Lennox International Inc. vs EMCOR Group, Inc.
Analyzing Cost of Revenue: Lennox International Inc. and AerCap Holdings N.V.
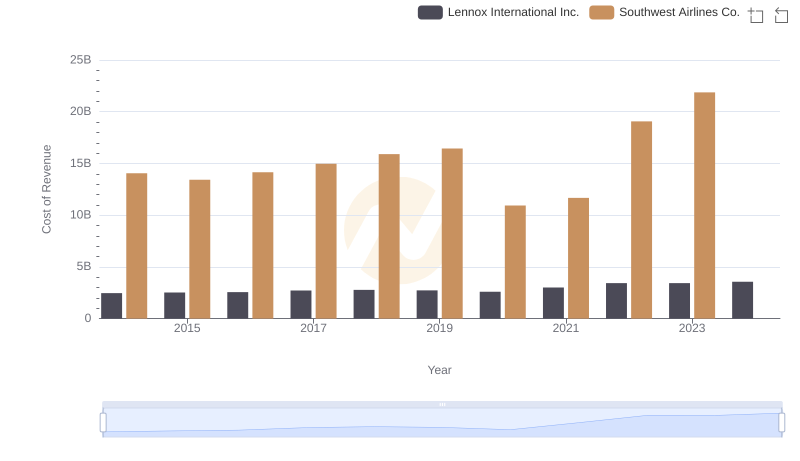
Comparing Cost of Revenue Efficiency: Lennox International Inc. vs Southwest Airlines Co.
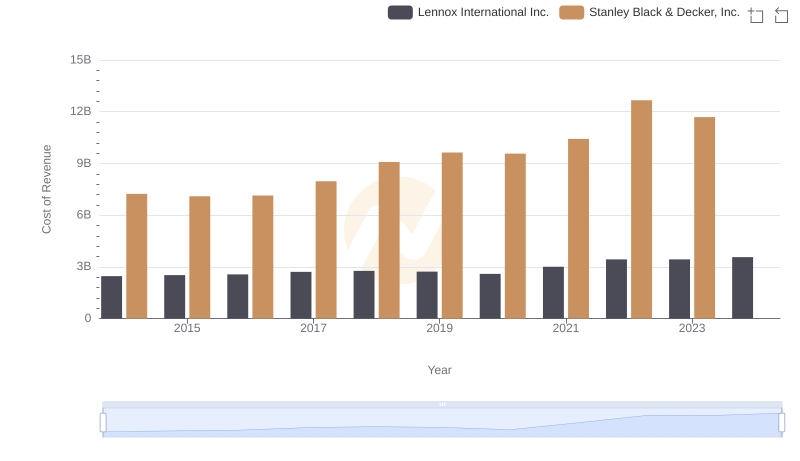
Lennox International Inc. vs Stanley Black & Decker, Inc.: Efficiency in Cost of Revenue Explored
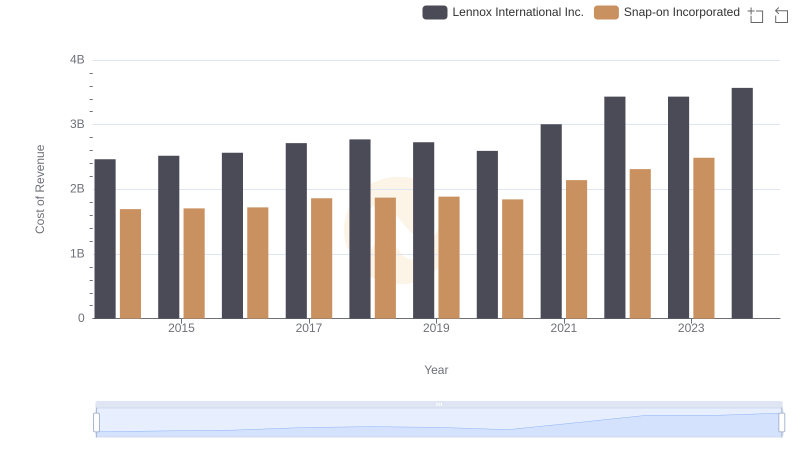
Cost Insights: Breaking Down Lennox International Inc. and Snap-on Incorporated's Expenses
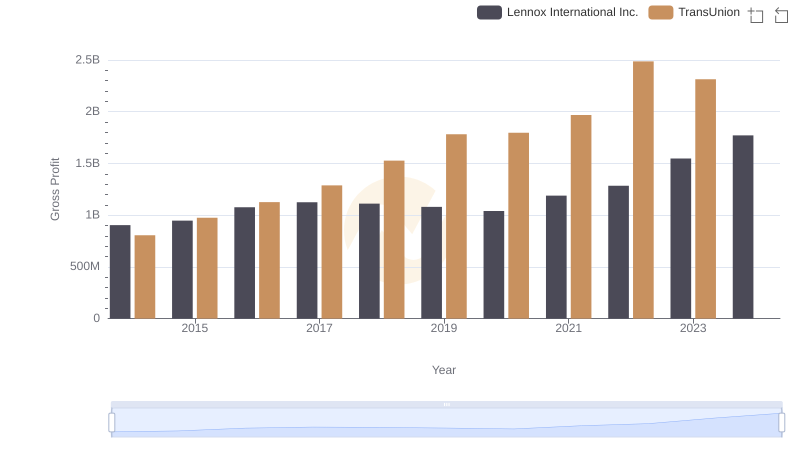
Gross Profit Trends Compared: Lennox International Inc. vs TransUnion
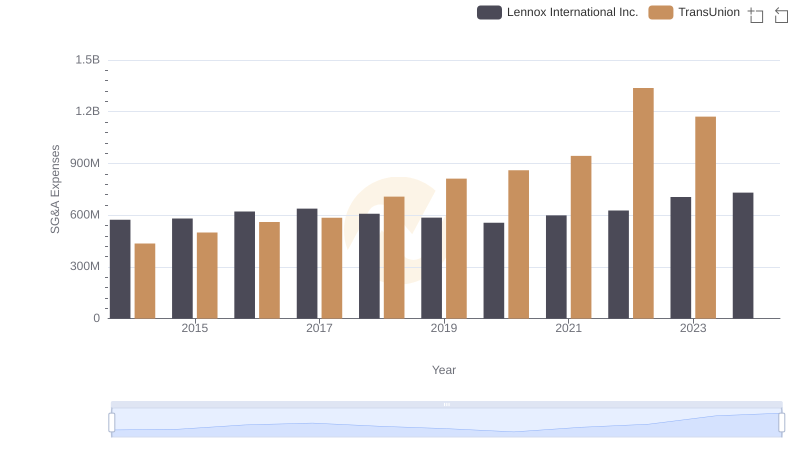
SG&A Efficiency Analysis: Comparing Lennox International Inc. and TransUnion
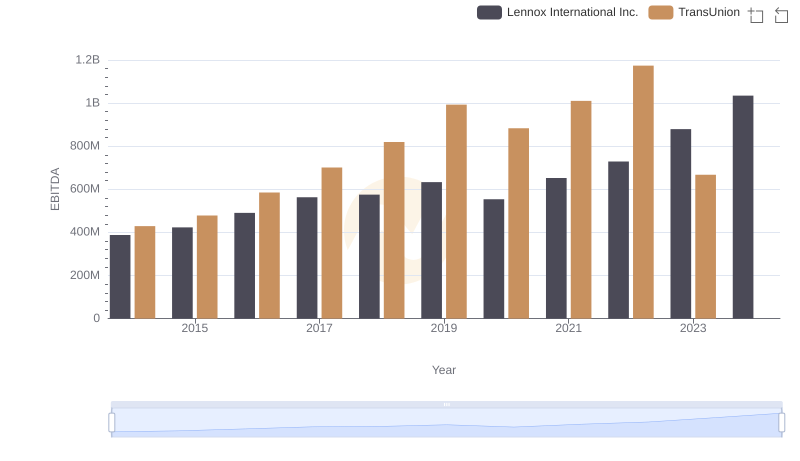
EBITDA Performance Review: Lennox International Inc. vs TransUnion