| __timestamp | Lennox International Inc. | TransUnion |
|---|---|---|
| Wednesday, January 1, 2014 | 387700000 | 429400000 |
| Thursday, January 1, 2015 | 423600000 | 478200000 |
| Friday, January 1, 2016 | 490800000 | 585300000 |
| Sunday, January 1, 2017 | 562900000 | 701100000 |
| Monday, January 1, 2018 | 575200000 | 819800000 |
| Tuesday, January 1, 2019 | 633300000 | 993200000 |
| Wednesday, January 1, 2020 | 553900000 | 883400000 |
| Friday, January 1, 2021 | 652500000 | 1010500000 |
| Saturday, January 1, 2022 | 729000000 | 1173800000 |
| Sunday, January 1, 2023 | 879500000 | 667300000 |
| Monday, January 1, 2024 | 1034800000 | 1204100000 |
Data in motion
In the competitive landscape of the HVAC and credit reporting industries, Lennox International Inc. and TransUnion have demonstrated remarkable EBITDA growth over the past decade. From 2014 to 2023, Lennox International Inc. saw its EBITDA increase by approximately 167%, peaking in 2024. This growth trajectory highlights the company's resilience and strategic prowess in navigating market challenges.
Conversely, TransUnion experienced a robust 173% growth in EBITDA from 2014 to 2022, before a notable dip in 2023. This decline could be attributed to market fluctuations or strategic shifts, warranting further analysis. Despite this, TransUnion's overall performance underscores its strong market position.
The data reveals a compelling narrative of two industry leaders adapting and thriving in dynamic environments, offering valuable insights for investors and industry analysts alike.
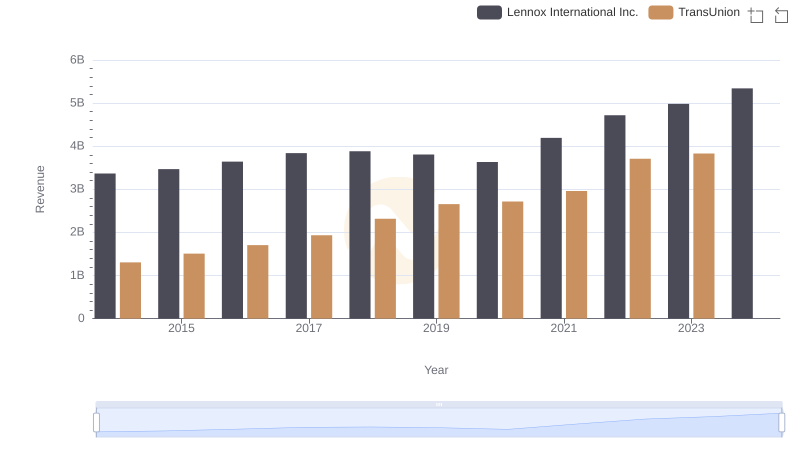
Lennox International Inc. vs TransUnion: Examining Key Revenue Metrics
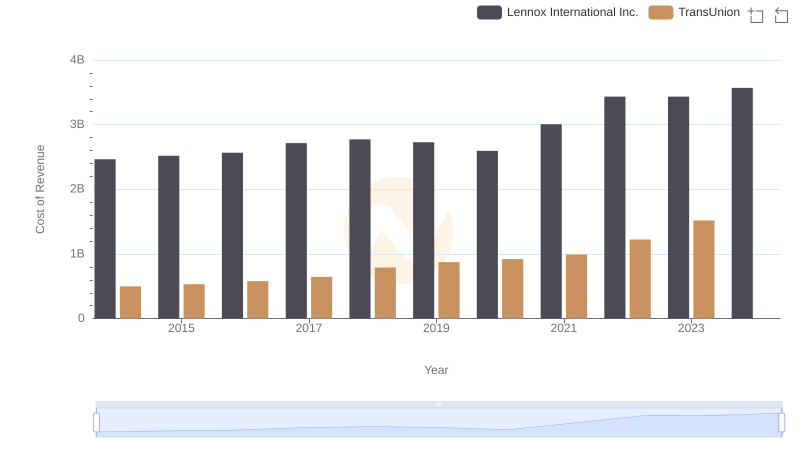
Comparing Cost of Revenue Efficiency: Lennox International Inc. vs TransUnion
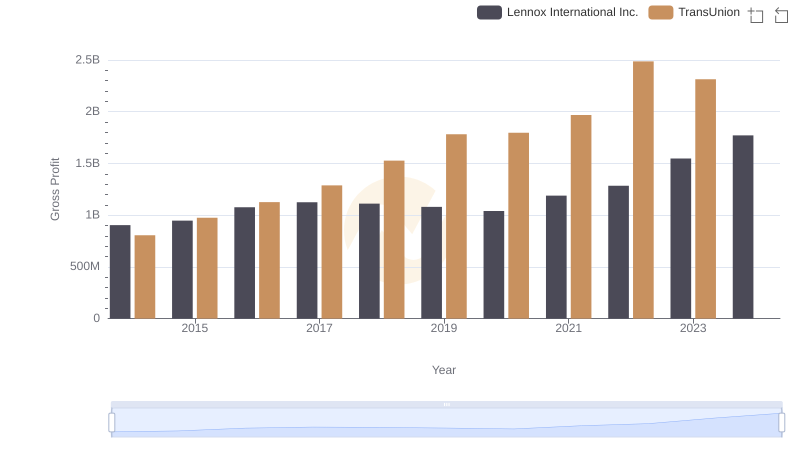
Gross Profit Trends Compared: Lennox International Inc. vs TransUnion
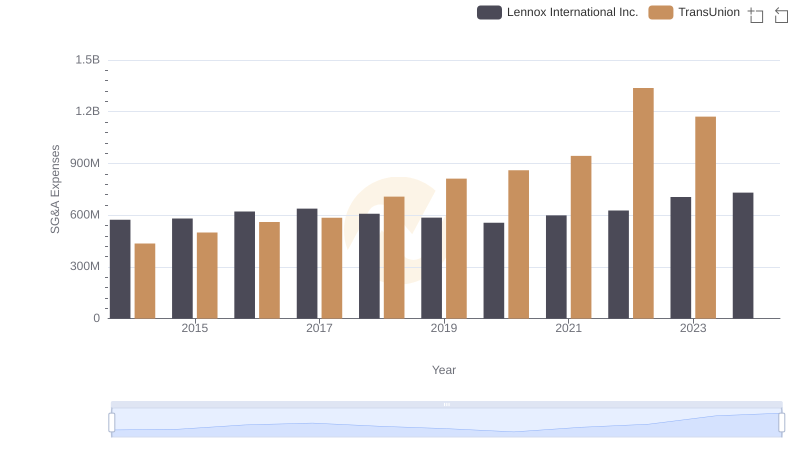
SG&A Efficiency Analysis: Comparing Lennox International Inc. and TransUnion
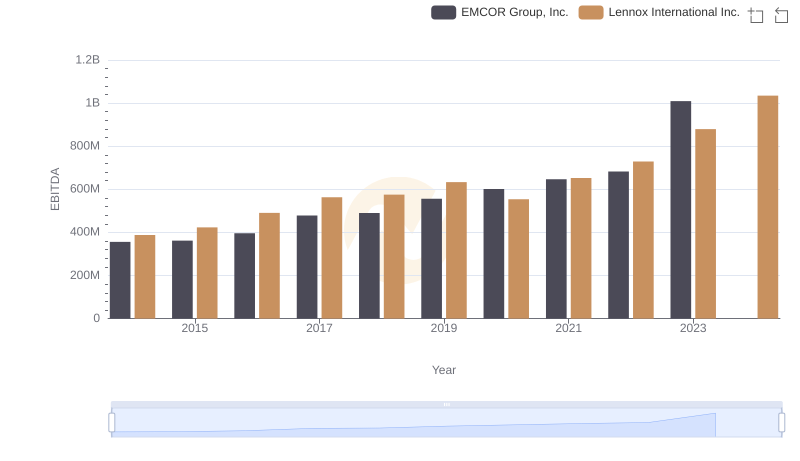
Lennox International Inc. vs EMCOR Group, Inc.: In-Depth EBITDA Performance Comparison
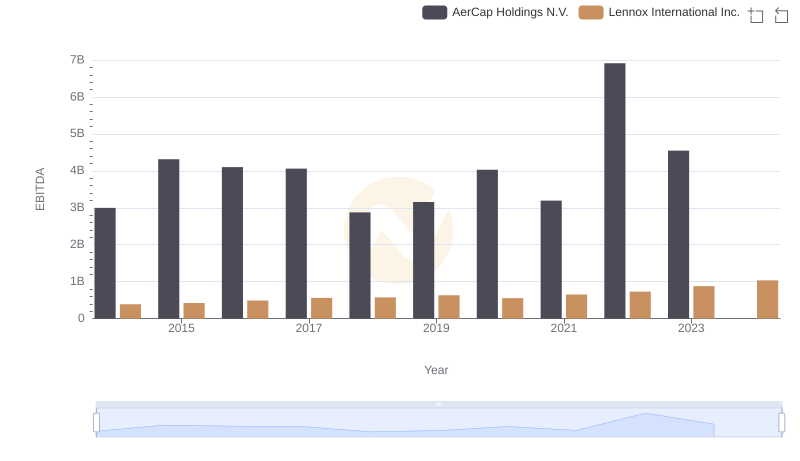
EBITDA Analysis: Evaluating Lennox International Inc. Against AerCap Holdings N.V.
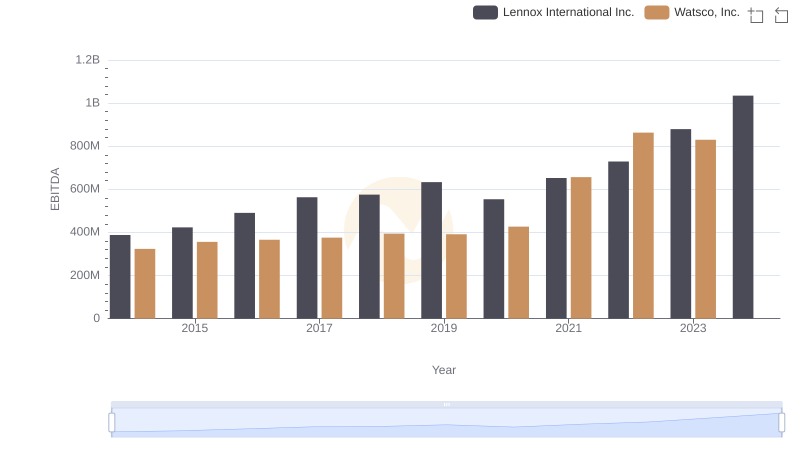
A Professional Review of EBITDA: Lennox International Inc. Compared to Watsco, Inc.

A Professional Review of EBITDA: Lennox International Inc. Compared to Stanley Black & Decker, Inc.
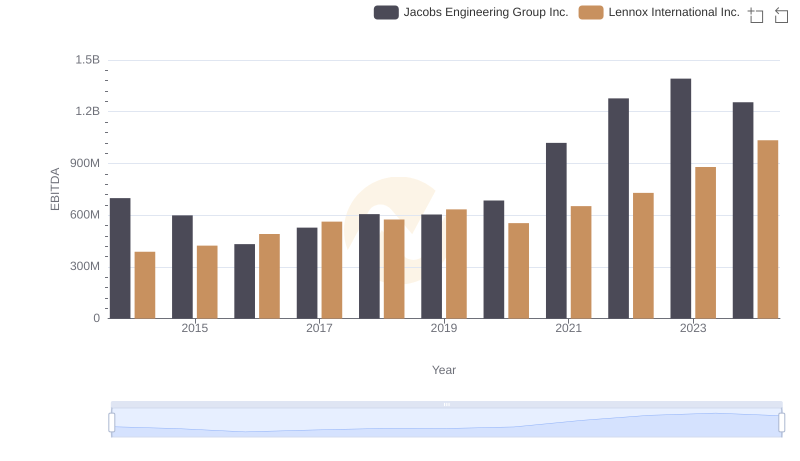
Lennox International Inc. and Jacobs Engineering Group Inc.: A Detailed Examination of EBITDA Performance
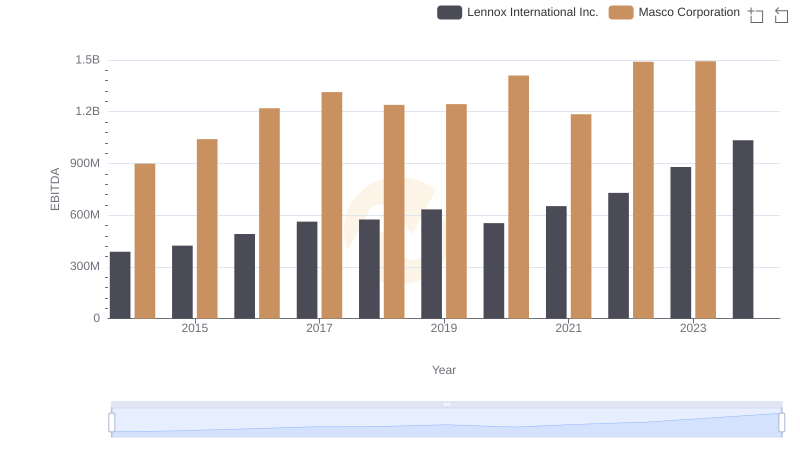
Comprehensive EBITDA Comparison: Lennox International Inc. vs Masco Corporation
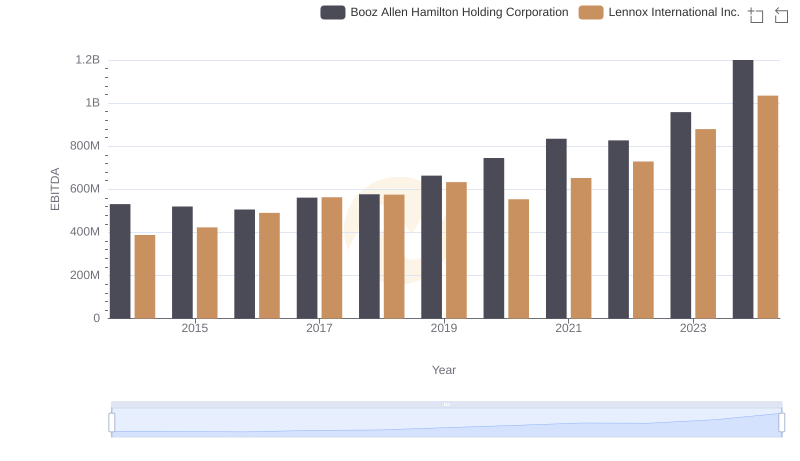
A Side-by-Side Analysis of EBITDA: Lennox International Inc. and Booz Allen Hamilton Holding Corporation
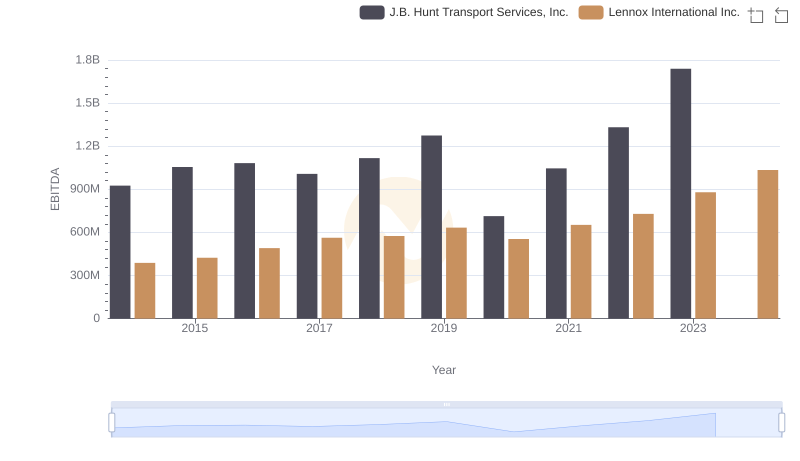
EBITDA Metrics Evaluated: Lennox International Inc. vs J.B. Hunt Transport Services, Inc.