| __timestamp | Lennox International Inc. | TransUnion |
|---|---|---|
| Wednesday, January 1, 2014 | 573700000 | 436000000 |
| Thursday, January 1, 2015 | 580500000 | 499700000 |
| Friday, January 1, 2016 | 621000000 | 560100000 |
| Sunday, January 1, 2017 | 637700000 | 585400000 |
| Monday, January 1, 2018 | 608200000 | 707700000 |
| Tuesday, January 1, 2019 | 585900000 | 812100000 |
| Wednesday, January 1, 2020 | 555900000 | 860300000 |
| Friday, January 1, 2021 | 598900000 | 943900000 |
| Saturday, January 1, 2022 | 627200000 | 1337400000 |
| Sunday, January 1, 2023 | 705500000 | 1171600000 |
| Monday, January 1, 2024 | 730600000 | 1239300000 |
Igniting the spark of knowledge
In the competitive landscape of corporate America, the efficiency of Selling, General, and Administrative (SG&A) expenses is a critical metric. Lennox International Inc. and TransUnion, two industry giants, have shown contrasting trends over the past decade.
From 2014 to 2023, Lennox International Inc. demonstrated a steady increase in SG&A expenses, peaking at approximately 730 million in 2023, marking a 27% rise from 2014. This consistent growth reflects their strategic investments in operational efficiency and market expansion.
Conversely, TransUnion's SG&A expenses surged by over 170% from 2014 to 2022, reaching a high of 1.34 billion. This sharp increase highlights their aggressive growth strategy, although data for 2024 remains unavailable.
These trends underscore the diverse approaches companies take in managing operational costs, offering valuable insights into their strategic priorities.
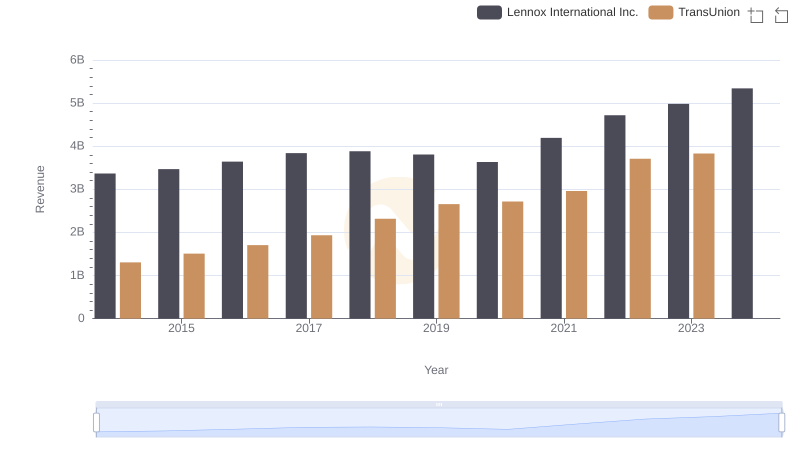
Lennox International Inc. vs TransUnion: Examining Key Revenue Metrics
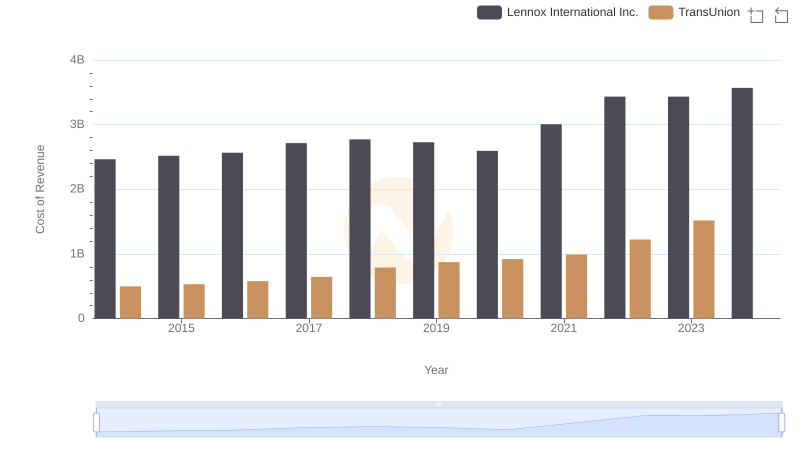
Comparing Cost of Revenue Efficiency: Lennox International Inc. vs TransUnion
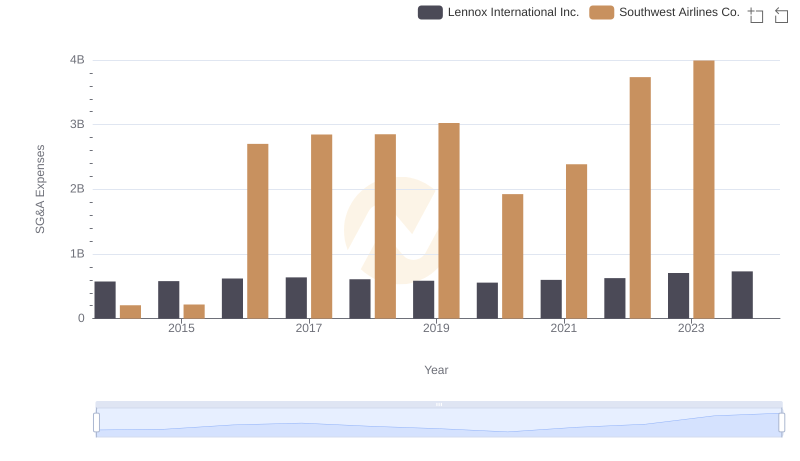
Cost Management Insights: SG&A Expenses for Lennox International Inc. and Southwest Airlines Co.
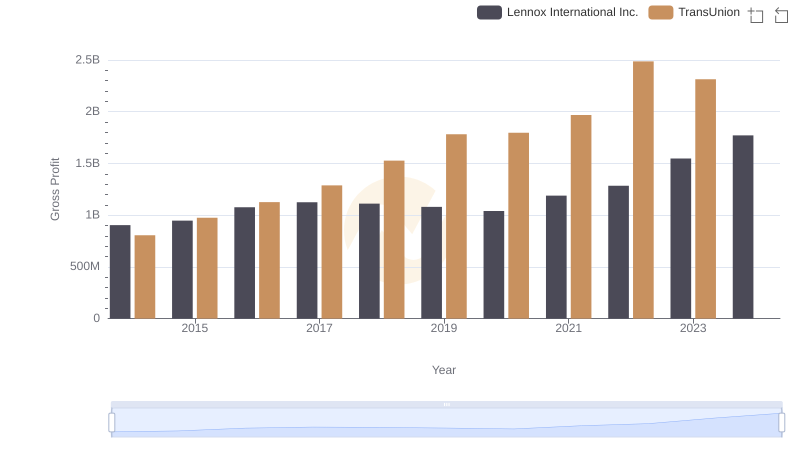
Gross Profit Trends Compared: Lennox International Inc. vs TransUnion
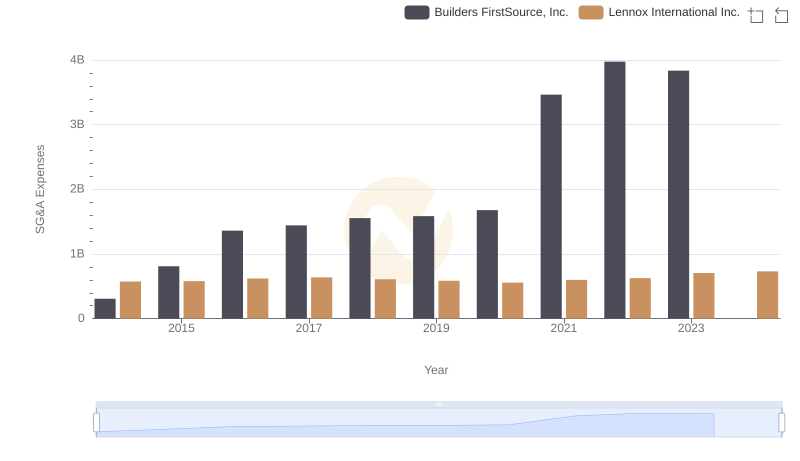
Lennox International Inc. or Builders FirstSource, Inc.: Who Manages SG&A Costs Better?
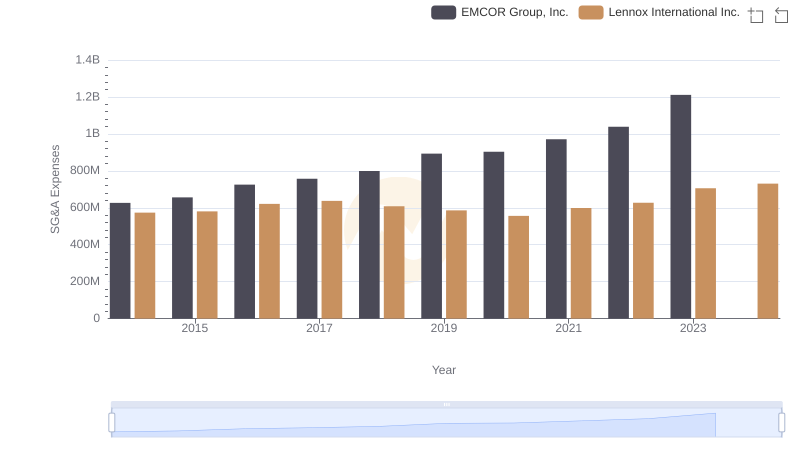
Who Optimizes SG&A Costs Better? Lennox International Inc. or EMCOR Group, Inc.
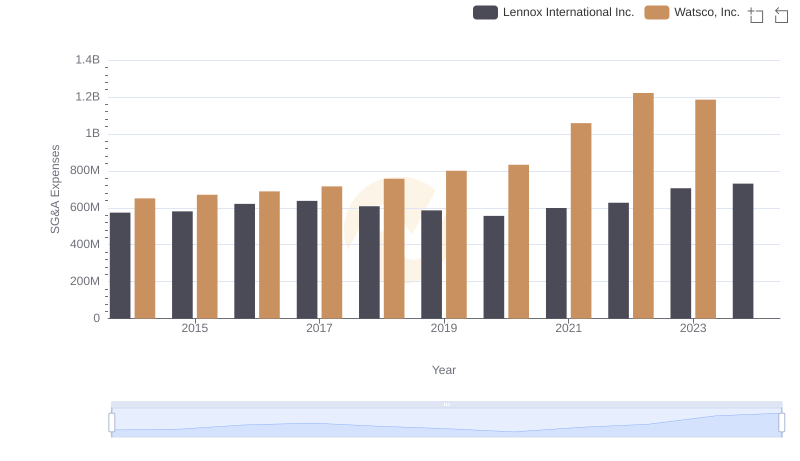
Operational Costs Compared: SG&A Analysis of Lennox International Inc. and Watsco, Inc.
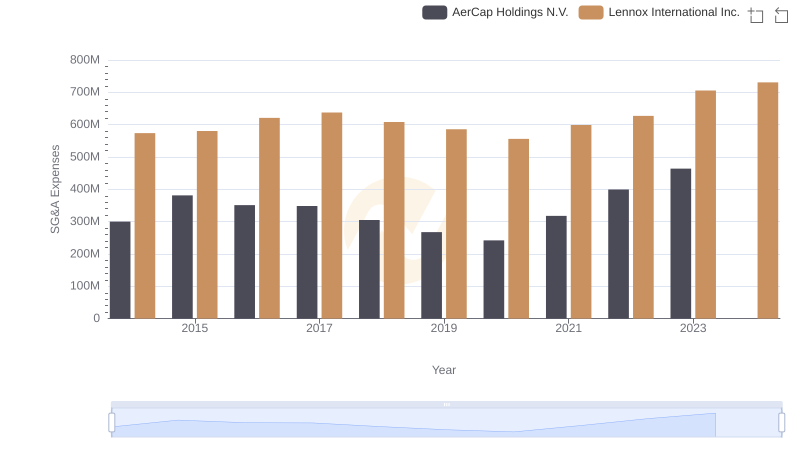
Operational Costs Compared: SG&A Analysis of Lennox International Inc. and AerCap Holdings N.V.
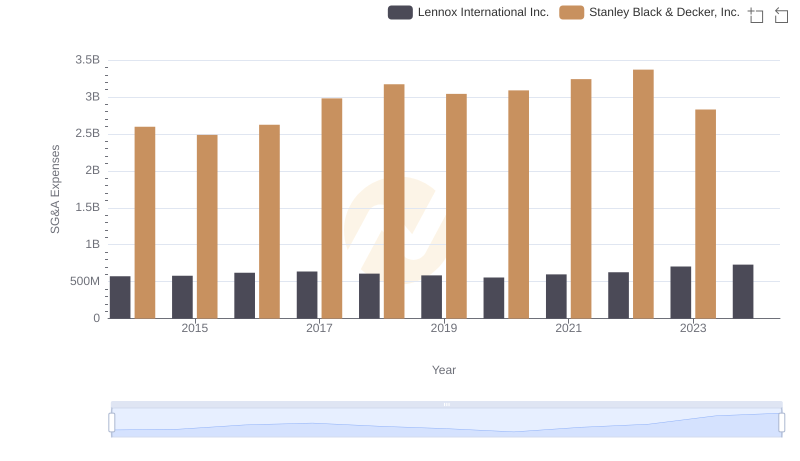
Who Optimizes SG&A Costs Better? Lennox International Inc. or Stanley Black & Decker, Inc.
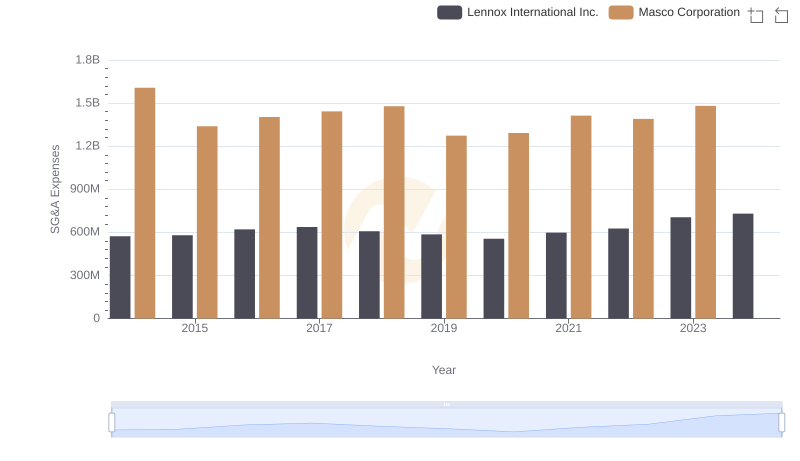
Lennox International Inc. or Masco Corporation: Who Manages SG&A Costs Better?
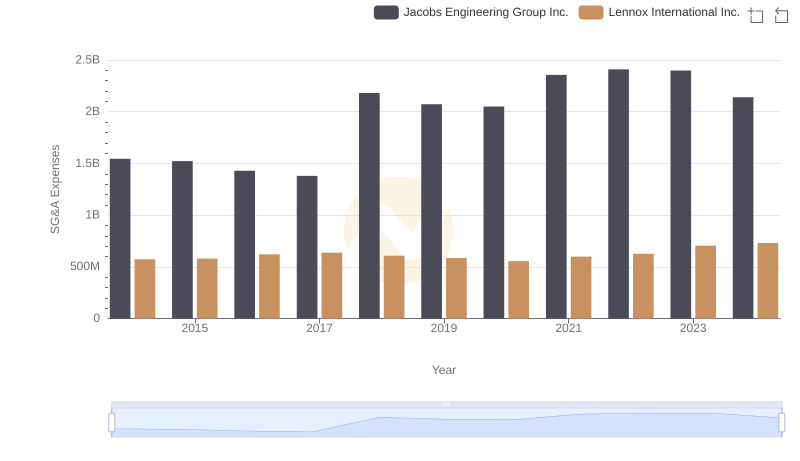
SG&A Efficiency Analysis: Comparing Lennox International Inc. and Jacobs Engineering Group Inc.
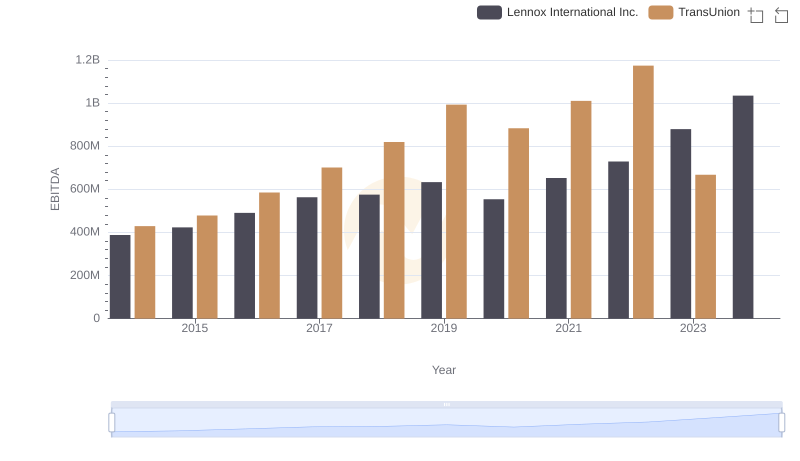
EBITDA Performance Review: Lennox International Inc. vs TransUnion