| __timestamp | AerCap Holdings N.V. | Lennox International Inc. |
|---|---|---|
| Wednesday, January 1, 2014 | 3535797000 | 3367400000 |
| Thursday, January 1, 2015 | 5598662000 | 3467400000 |
| Friday, January 1, 2016 | 5152131000 | 3641600000 |
| Sunday, January 1, 2017 | 5037493000 | 3839600000 |
| Monday, January 1, 2018 | 4799980000 | 3883900000 |
| Tuesday, January 1, 2019 | 4937340000 | 3807200000 |
| Wednesday, January 1, 2020 | 4493629000 | 3634100000 |
| Friday, January 1, 2021 | 4588930000 | 4194100000 |
| Saturday, January 1, 2022 | 6914985000 | 4718400000 |
| Sunday, January 1, 2023 | 7574664000 | 4981900000 |
| Monday, January 1, 2024 | 5341300000 |
Unveiling the hidden dimensions of data
In the ever-evolving landscape of global business, Lennox International Inc. and AerCap Holdings N.V. stand as titans in their respective industries. From 2014 to 2023, these companies have showcased remarkable revenue trajectories, reflecting their strategic prowess and market adaptability. AerCap Holdings, a leader in aircraft leasing, saw its revenue soar by over 114% from 2014 to 2023, peaking in 2023 with a staggering 7.57 billion USD. Meanwhile, Lennox International, a stalwart in climate control solutions, experienced a steady growth of approximately 48% over the same period, reaching 4.98 billion USD in 2023. Notably, 2024 data for AerCap is missing, leaving a gap in the narrative of its financial journey. This comparison not only highlights the resilience and growth strategies of these companies but also offers insights into the broader economic trends influencing their sectors.
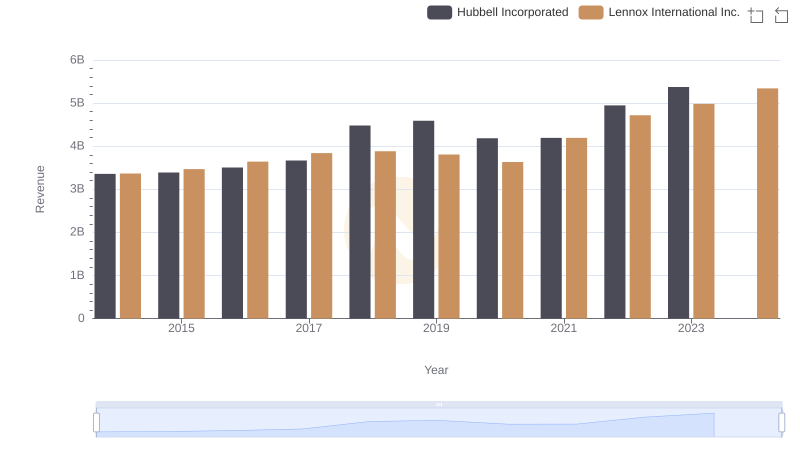
Revenue Showdown: Lennox International Inc. vs Hubbell Incorporated
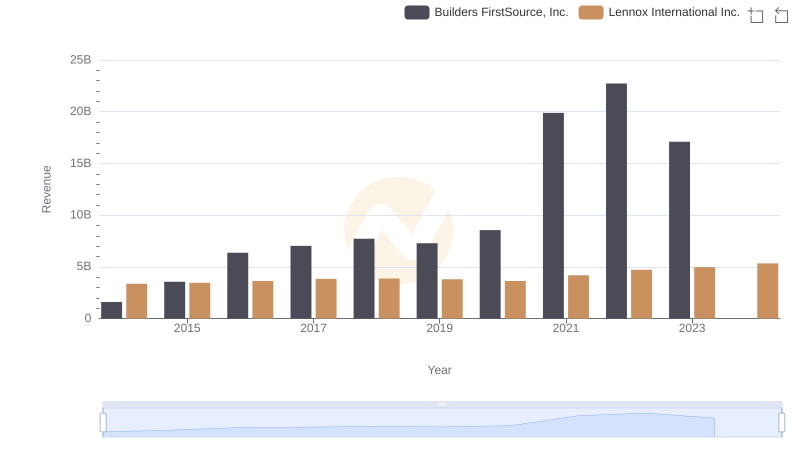
Lennox International Inc. and Builders FirstSource, Inc.: A Comprehensive Revenue Analysis
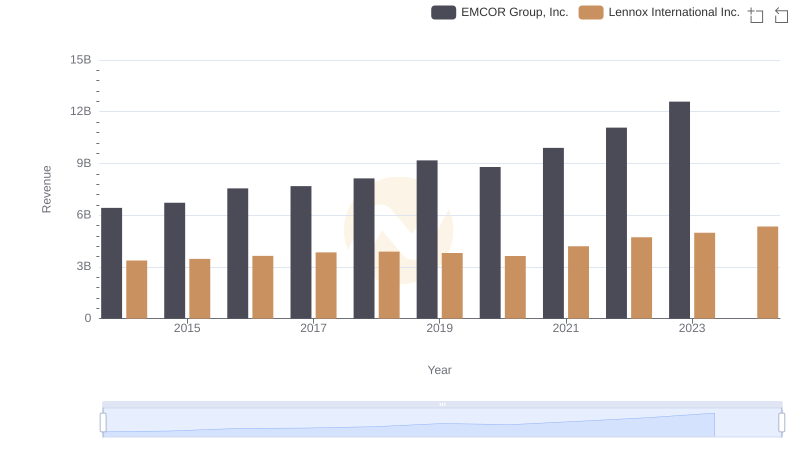
Who Generates More Revenue? Lennox International Inc. or EMCOR Group, Inc.
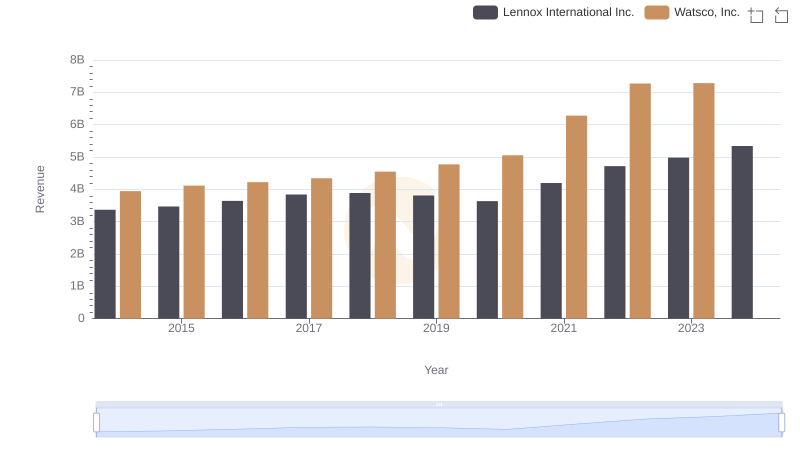
Comparing Revenue Performance: Lennox International Inc. or Watsco, Inc.?
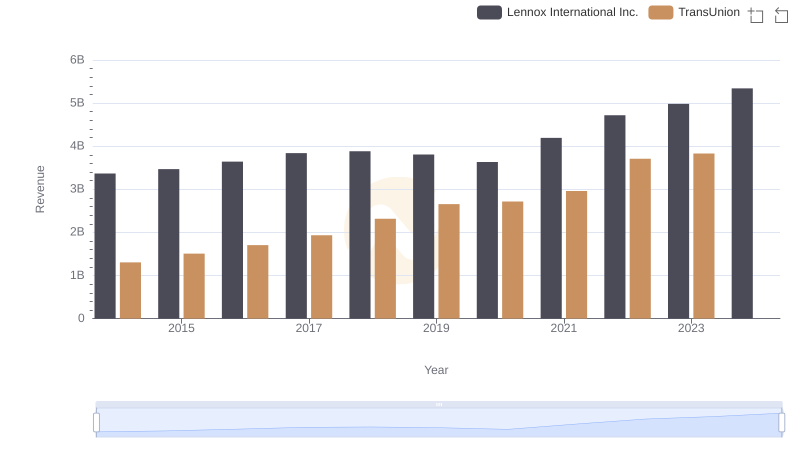
Lennox International Inc. vs TransUnion: Examining Key Revenue Metrics
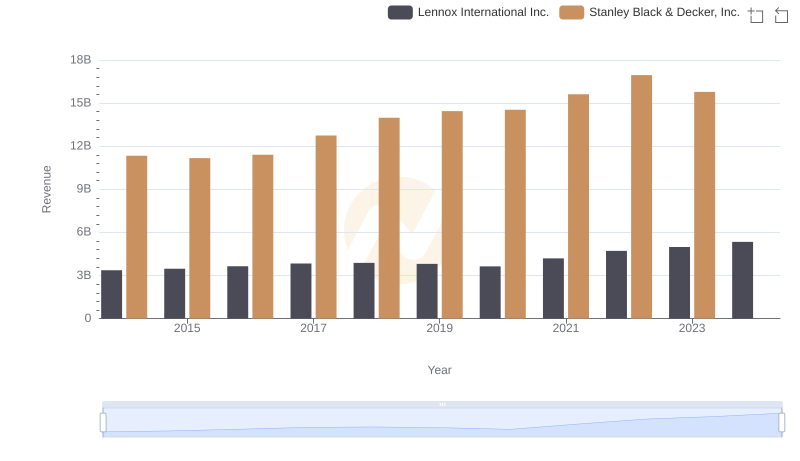
Lennox International Inc. vs Stanley Black & Decker, Inc.: Annual Revenue Growth Compared
Analyzing Cost of Revenue: Lennox International Inc. and AerCap Holdings N.V.
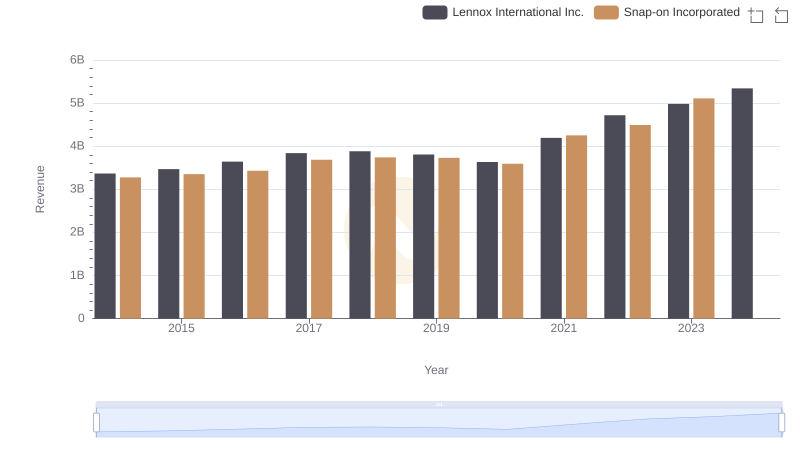
Lennox International Inc. vs Snap-on Incorporated: Examining Key Revenue Metrics
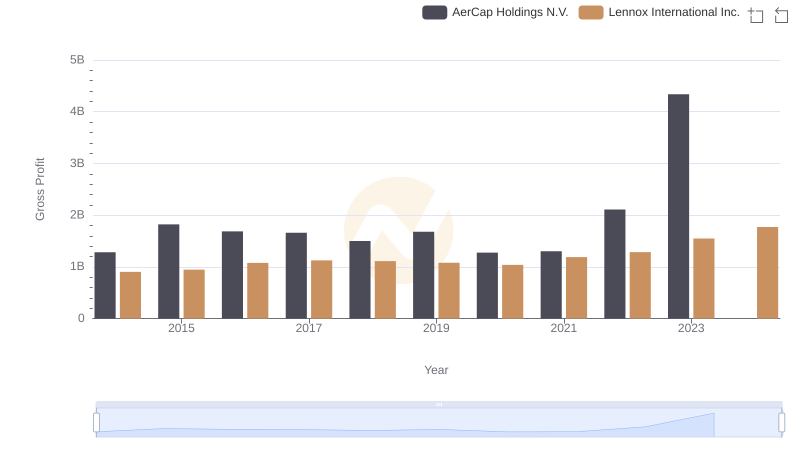
Gross Profit Trends Compared: Lennox International Inc. vs AerCap Holdings N.V.
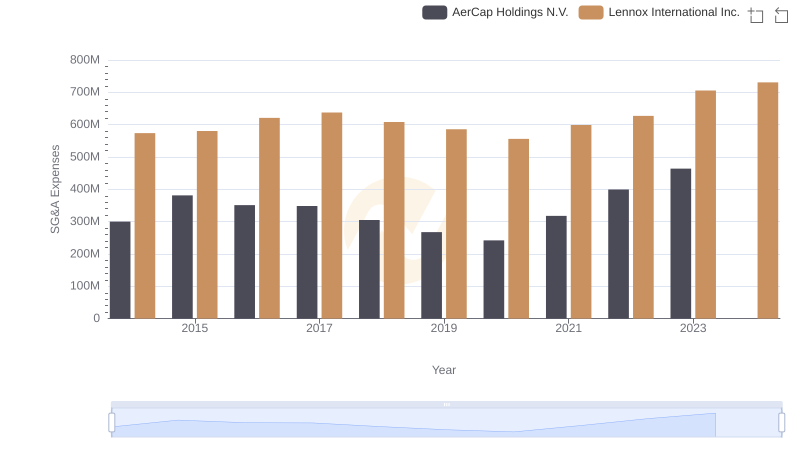
Operational Costs Compared: SG&A Analysis of Lennox International Inc. and AerCap Holdings N.V.
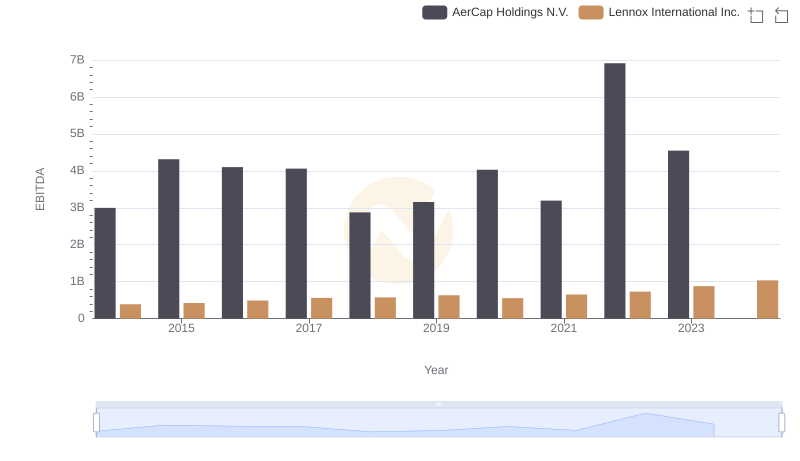
EBITDA Analysis: Evaluating Lennox International Inc. Against AerCap Holdings N.V.