| __timestamp | Intuit Inc. | Sony Group Corporation |
|---|---|---|
| Wednesday, January 1, 2014 | 1528000000 | 711569000000 |
| Thursday, January 1, 2015 | 970000000 | 690894000000 |
| Friday, January 1, 2016 | 1480000000 | 1026468000000 |
| Sunday, January 1, 2017 | 1634000000 | 890716000000 |
| Monday, January 1, 2018 | 1839000000 | 1433333000000 |
| Tuesday, January 1, 2019 | 2121000000 | 1746634000000 |
| Wednesday, January 1, 2020 | 2430000000 | 1556991000000 |
| Friday, January 1, 2021 | 2948000000 | 1637322000000 |
| Saturday, January 1, 2022 | 3369000000 | 2056876000000 |
| Sunday, January 1, 2023 | 4043000000 | 2305484000000 |
| Monday, January 1, 2024 | 4581000000 | 2454639000000 |
Unlocking the unknown
In the ever-evolving landscape of global business, the financial performance of industry giants like Intuit Inc. and Sony Group Corporation offers a fascinating glimpse into strategic growth and market adaptation. Over the past decade, from 2014 to 2024, both companies have demonstrated remarkable EBITDA growth, albeit on different scales.
Intuit Inc., a leader in financial software, has seen its EBITDA grow by approximately 200%, reflecting its robust expansion and innovation in the fintech sector. Meanwhile, Sony Group Corporation, a titan in electronics and entertainment, has experienced a 245% increase in EBITDA, underscoring its successful diversification and global reach.
This comparative analysis not only highlights the resilience and adaptability of these corporations but also provides valuable insights into their strategic priorities and market positioning in a rapidly changing economic environment.
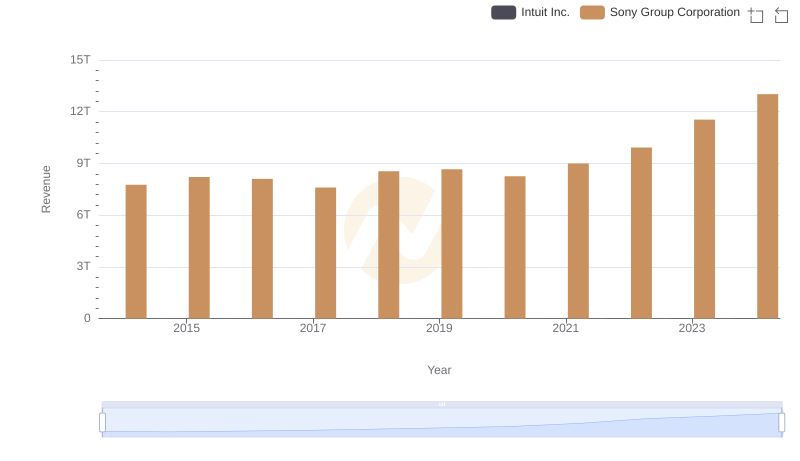
Annual Revenue Comparison: Intuit Inc. vs Sony Group Corporation
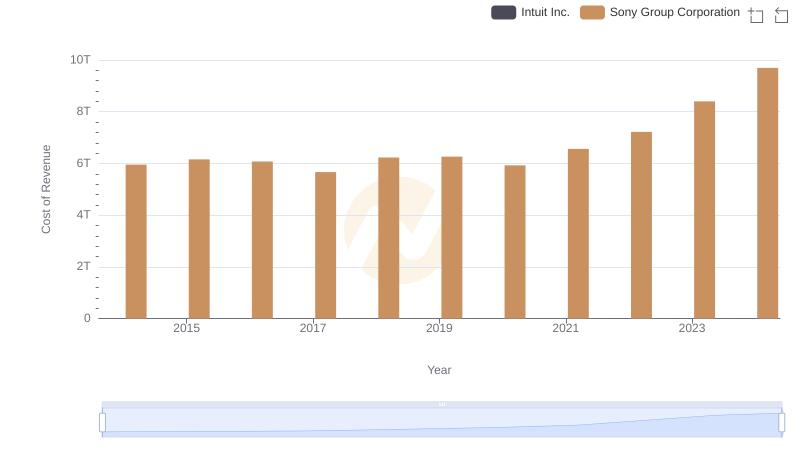
Cost of Revenue Trends: Intuit Inc. vs Sony Group Corporation
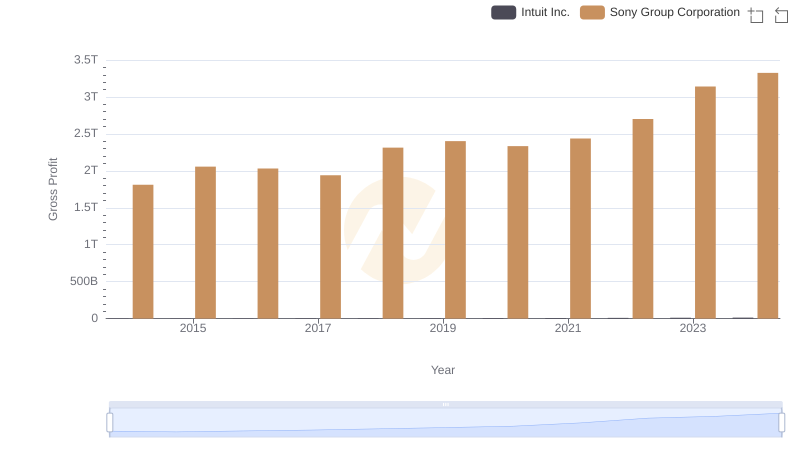
Gross Profit Analysis: Comparing Intuit Inc. and Sony Group Corporation
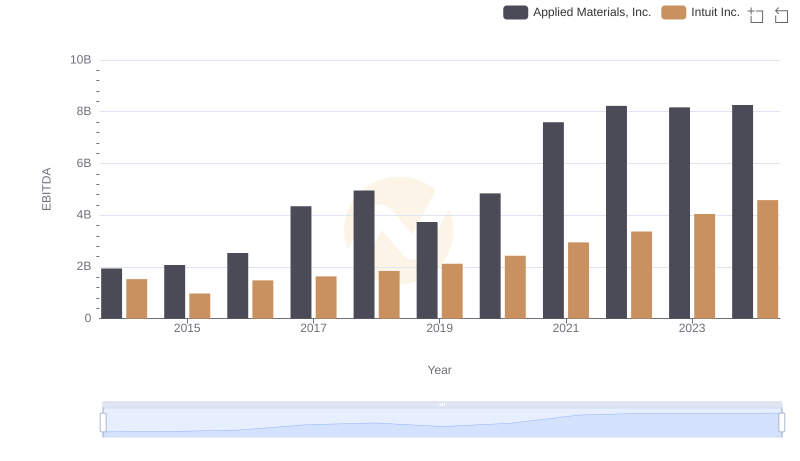
EBITDA Performance Review: Intuit Inc. vs Applied Materials, Inc.
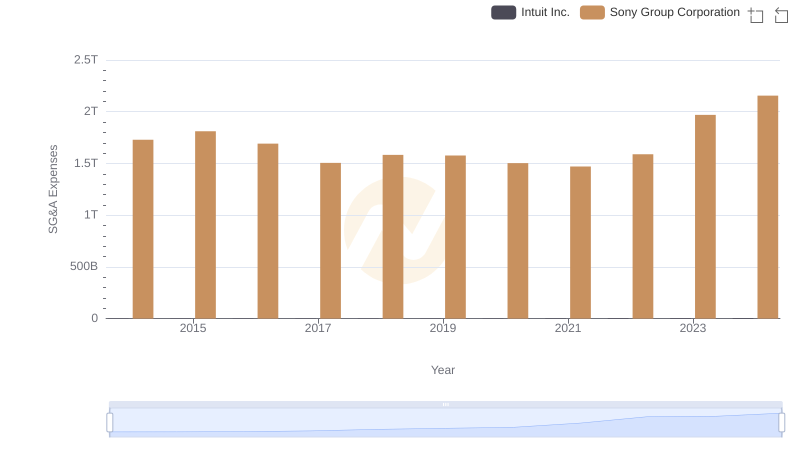
Who Optimizes SG&A Costs Better? Intuit Inc. or Sony Group Corporation
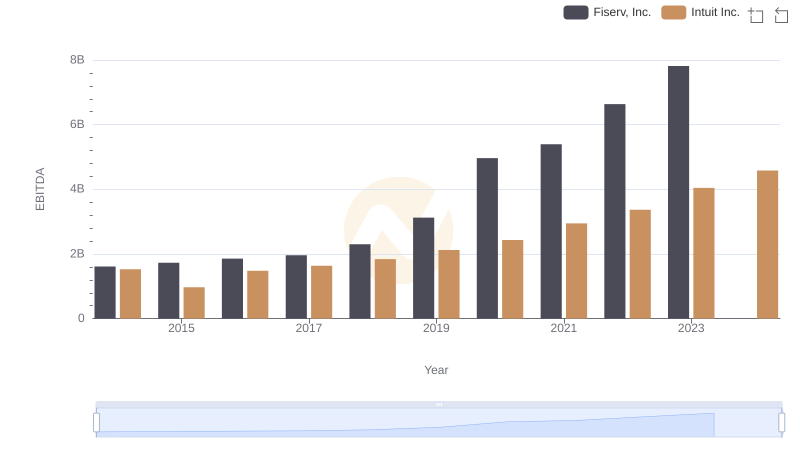
Comprehensive EBITDA Comparison: Intuit Inc. vs Fiserv, Inc.
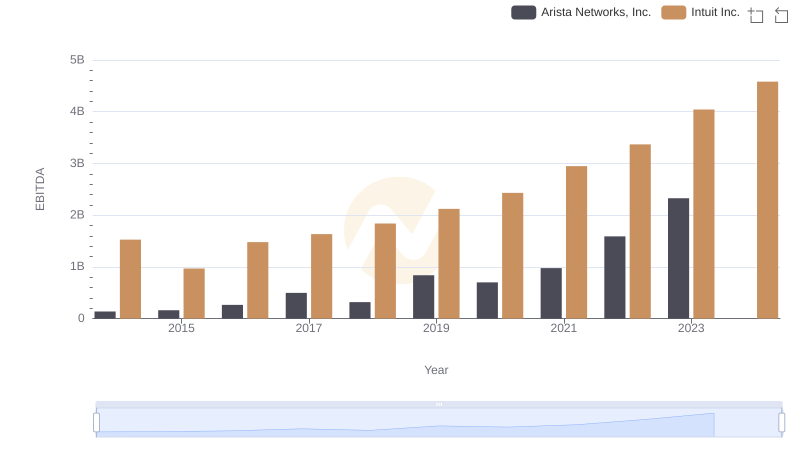
Intuit Inc. and Arista Networks, Inc.: A Detailed Examination of EBITDA Performance

Comprehensive EBITDA Comparison: Intuit Inc. vs Fiserv, Inc.
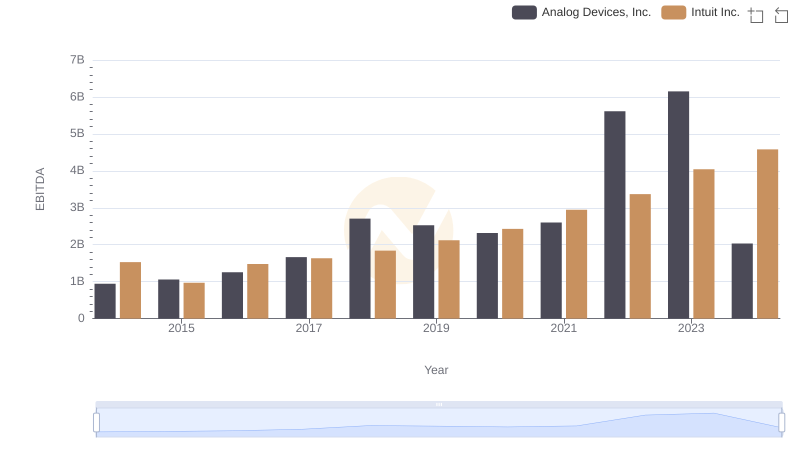
A Side-by-Side Analysis of EBITDA: Intuit Inc. and Analog Devices, Inc.
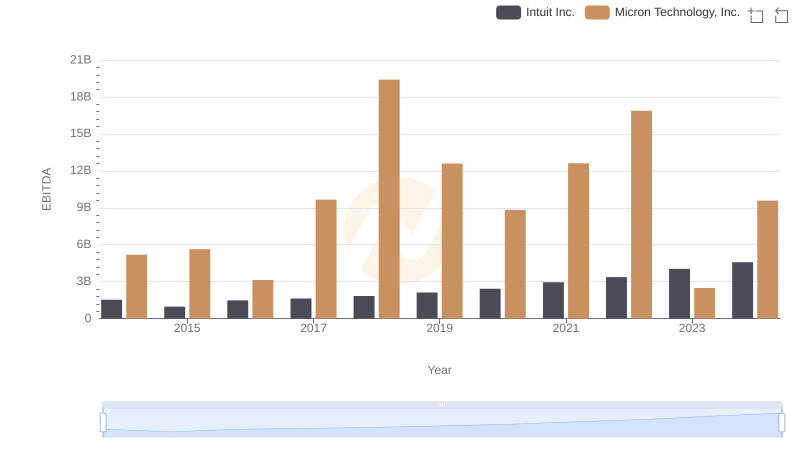
A Side-by-Side Analysis of EBITDA: Intuit Inc. and Micron Technology, Inc.
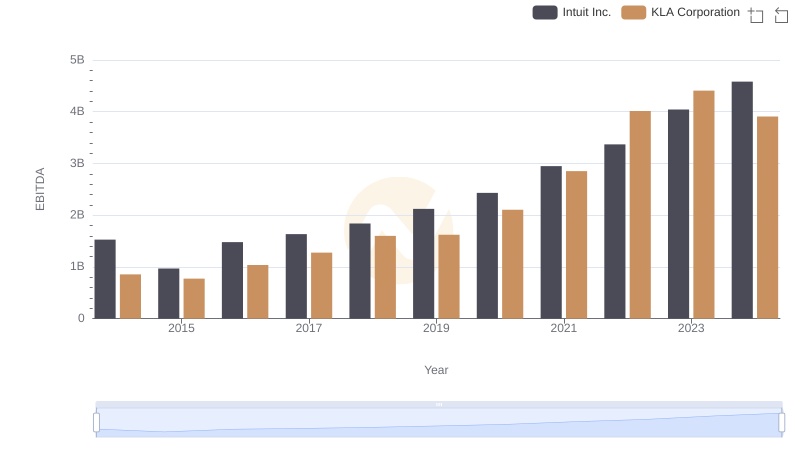
Intuit Inc. vs KLA Corporation: In-Depth EBITDA Performance Comparison
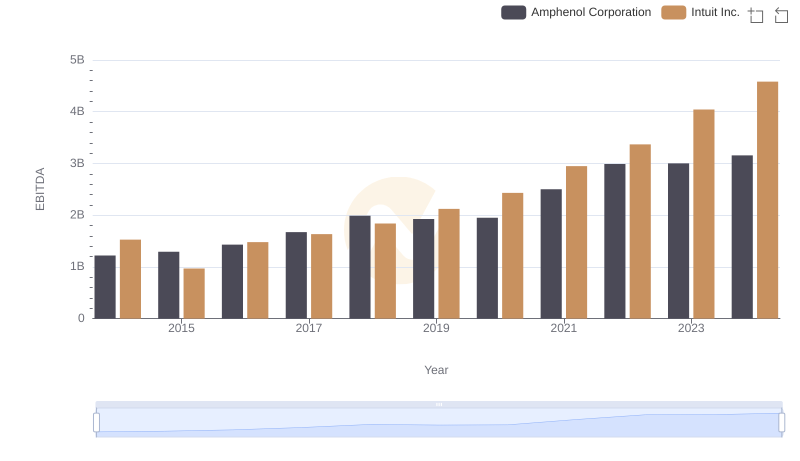
A Side-by-Side Analysis of EBITDA: Intuit Inc. and Amphenol Corporation