| __timestamp | Intuit Inc. | Micron Technology, Inc. |
|---|---|---|
| Wednesday, January 1, 2014 | 1528000000 | 5188000000 |
| Thursday, January 1, 2015 | 970000000 | 5647000000 |
| Friday, January 1, 2016 | 1480000000 | 3136000000 |
| Sunday, January 1, 2017 | 1634000000 | 9658000000 |
| Monday, January 1, 2018 | 1839000000 | 19408000000 |
| Tuesday, January 1, 2019 | 2121000000 | 12600000000 |
| Wednesday, January 1, 2020 | 2430000000 | 8827000000 |
| Friday, January 1, 2021 | 2948000000 | 12615000000 |
| Saturday, January 1, 2022 | 3369000000 | 16876000000 |
| Sunday, January 1, 2023 | 4043000000 | 2486000000 |
| Monday, January 1, 2024 | 4581000000 | 9582000000 |
Igniting the spark of knowledge
In the ever-evolving landscape of technology, financial performance is a key indicator of a company's resilience and growth. This analysis delves into the EBITDA trends of two tech giants, Intuit Inc. and Micron Technology, Inc., from 2014 to 2024.
Intuit Inc., known for its financial software, has shown a steady upward trajectory, with its EBITDA growing by approximately 200% over the decade. In contrast, Micron Technology, a leader in memory and storage solutions, experienced more volatility. Despite a peak in 2018, Micron's EBITDA saw a significant dip in 2023, dropping by nearly 85% from its 2022 high.
This side-by-side comparison highlights the contrasting financial journeys of these companies, offering insights into their strategic maneuvers and market adaptability. As we look to the future, these trends may serve as a barometer for potential investors and industry analysts alike.
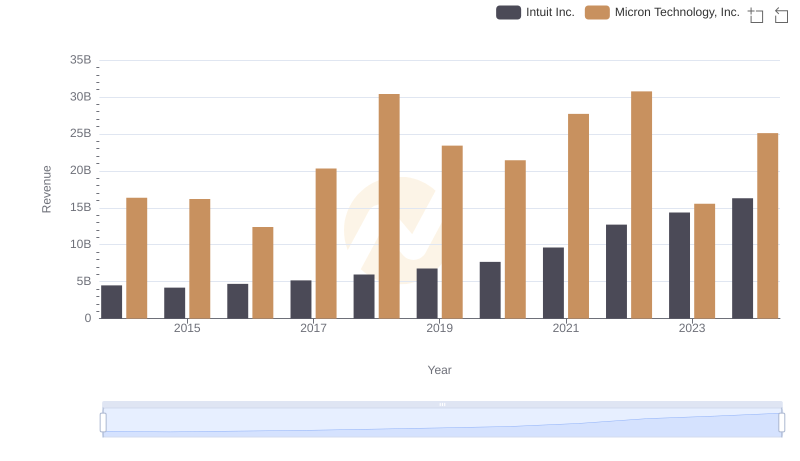
Breaking Down Revenue Trends: Intuit Inc. vs Micron Technology, Inc.
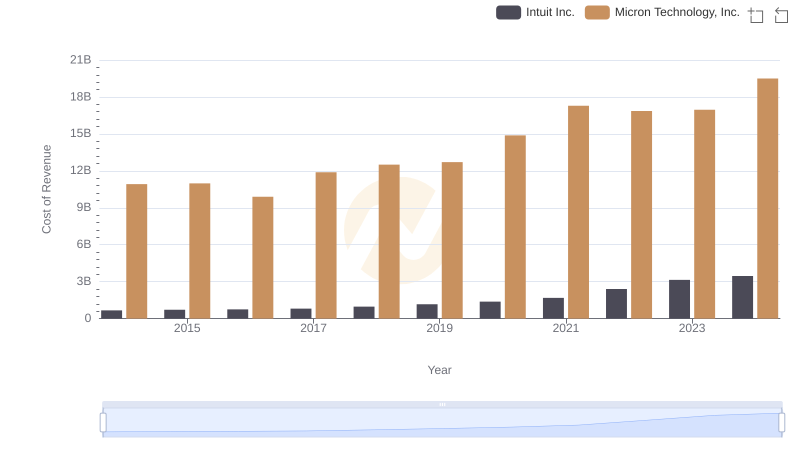
Cost of Revenue Trends: Intuit Inc. vs Micron Technology, Inc.
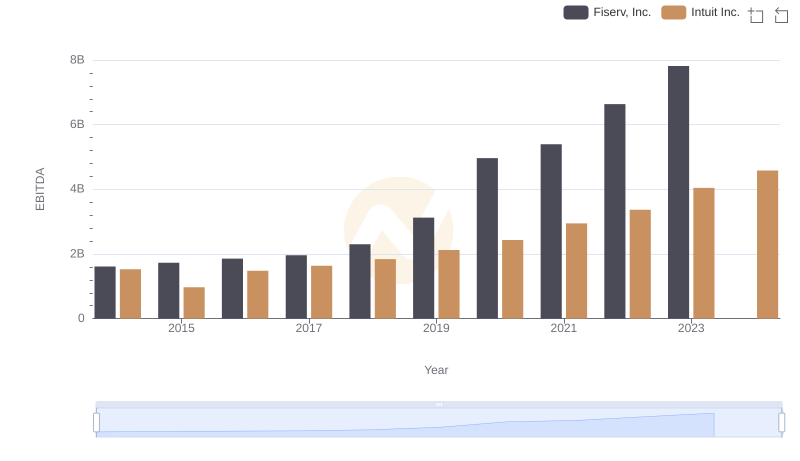
Comprehensive EBITDA Comparison: Intuit Inc. vs Fiserv, Inc.
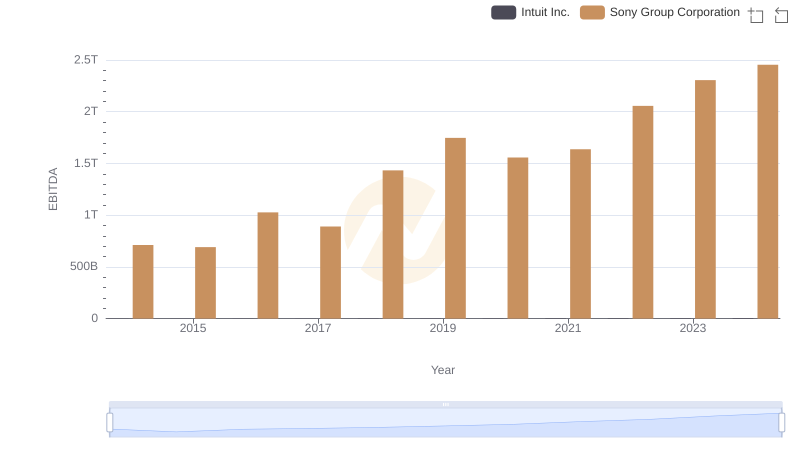
EBITDA Performance Review: Intuit Inc. vs Sony Group Corporation
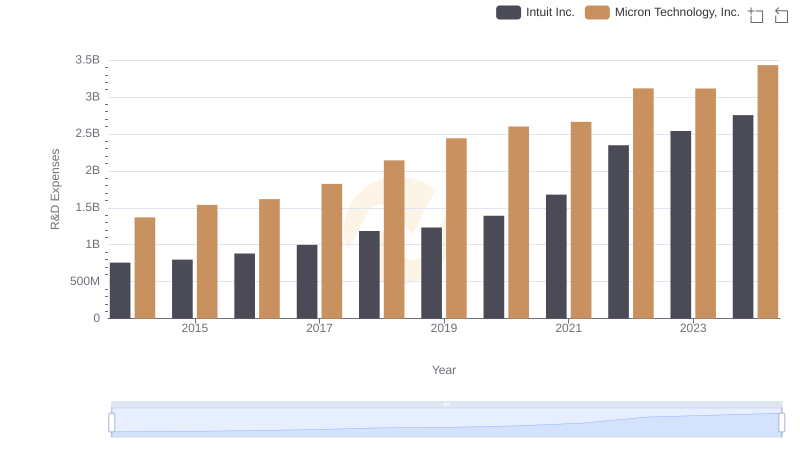
Who Prioritizes Innovation? R&D Spending Compared for Intuit Inc. and Micron Technology, Inc.
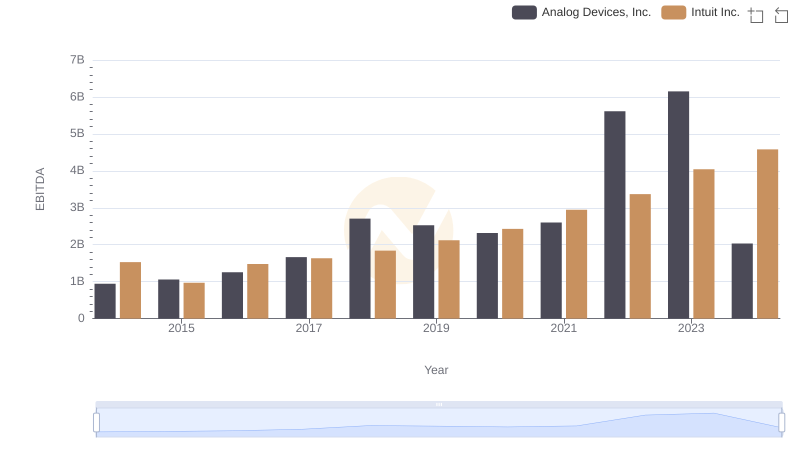
A Side-by-Side Analysis of EBITDA: Intuit Inc. and Analog Devices, Inc.
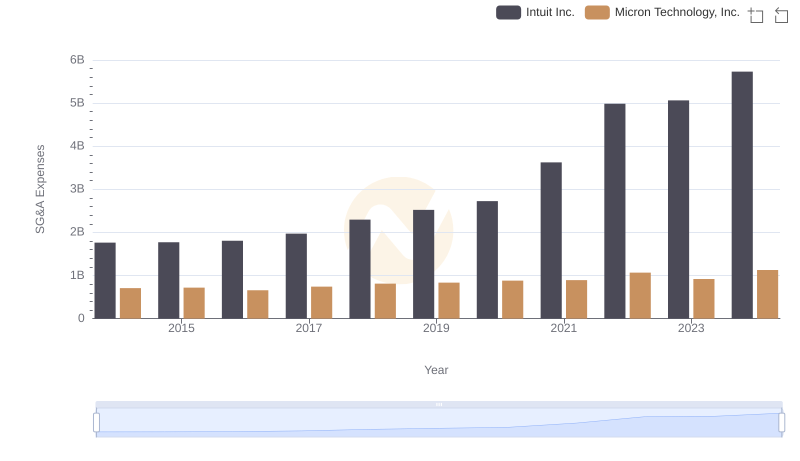
Who Optimizes SG&A Costs Better? Intuit Inc. or Micron Technology, Inc.
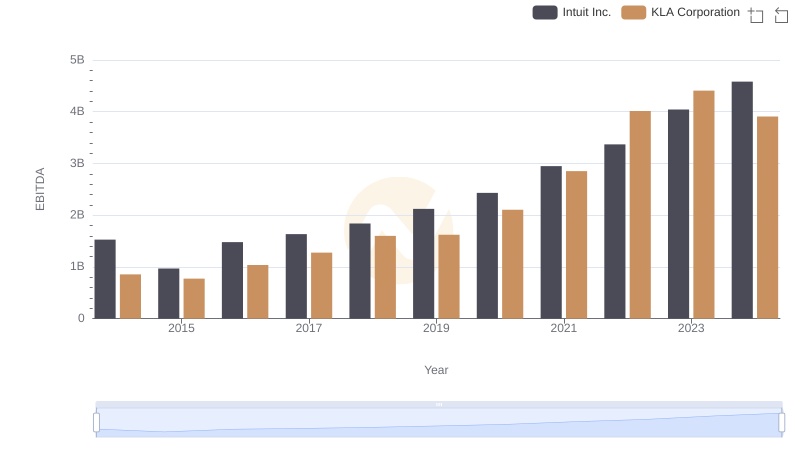
Intuit Inc. vs KLA Corporation: In-Depth EBITDA Performance Comparison
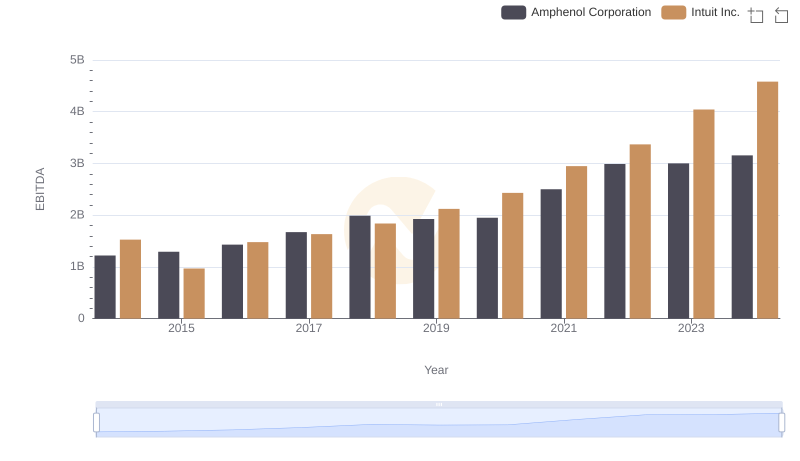
A Side-by-Side Analysis of EBITDA: Intuit Inc. and Amphenol Corporation
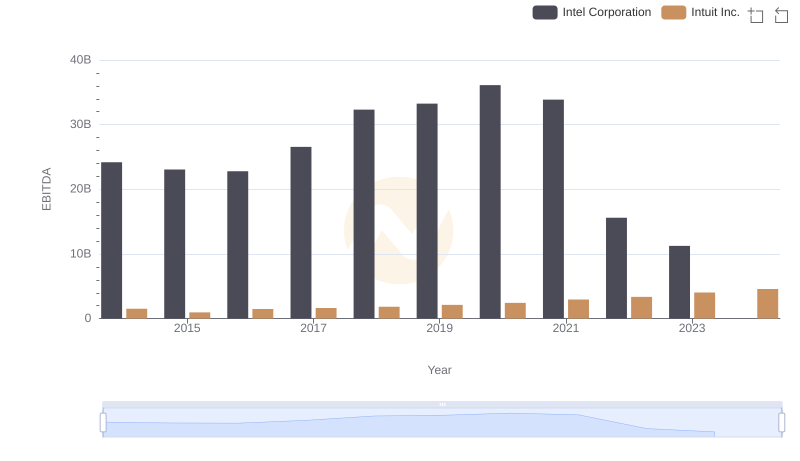
A Professional Review of EBITDA: Intuit Inc. Compared to Intel Corporation
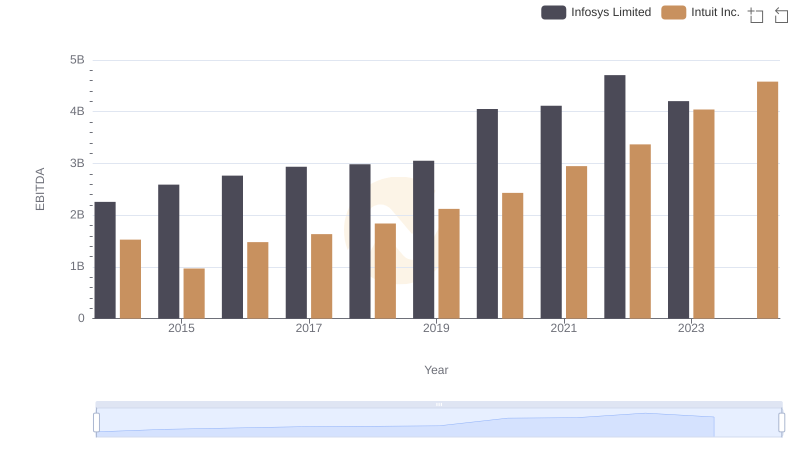
Intuit Inc. and Infosys Limited: A Detailed Examination of EBITDA Performance
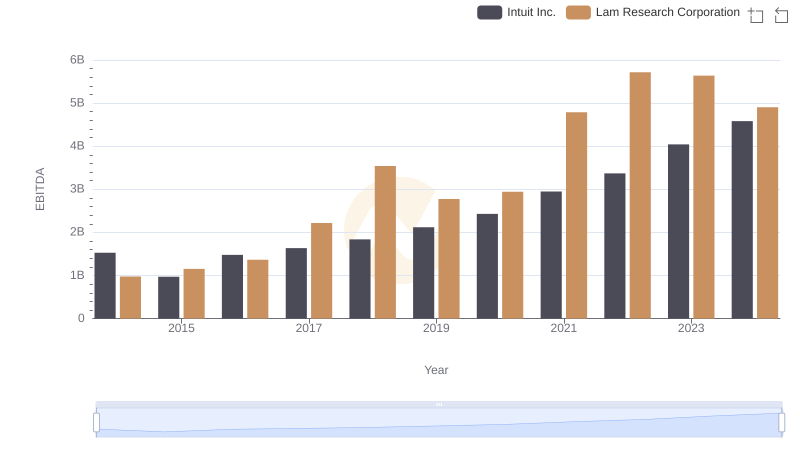
Intuit Inc. and Lam Research Corporation: A Detailed Examination of EBITDA Performance