| __timestamp | Intuit Inc. | Sony Group Corporation |
|---|---|---|
| Wednesday, January 1, 2014 | 3838000000 | 1811055000000 |
| Thursday, January 1, 2015 | 3467000000 | 2057746000000 |
| Friday, January 1, 2016 | 3942000000 | 2031060000000 |
| Sunday, January 1, 2017 | 4368000000 | 1940096000000 |
| Monday, January 1, 2018 | 4987000000 | 2313560000000 |
| Tuesday, January 1, 2019 | 5617000000 | 2402491000000 |
| Wednesday, January 1, 2020 | 6301000000 | 2334836000000 |
| Friday, January 1, 2021 | 7950000000 | 2437801000000 |
| Saturday, January 1, 2022 | 10320000000 | 2701672000000 |
| Sunday, January 1, 2023 | 11225000000 | 3140906000000 |
| Monday, January 1, 2024 | 12820000000 | 3325081000000 |
Data in motion
In the ever-evolving landscape of global business, understanding the financial health of industry giants is crucial. This analysis delves into the gross profit trends of two major corporations: Intuit Inc., a leader in financial software, and Sony Group Corporation, a titan in electronics and entertainment. From 2014 to 2024, Intuit's gross profit surged by approximately 234%, reflecting its robust growth in the tech sector. Meanwhile, Sony's gross profit, though already massive, increased by about 84%, showcasing its resilience and adaptability in a competitive market.
These trends highlight the dynamic nature of these industries and the strategic maneuvers by these corporations to maintain their market positions.
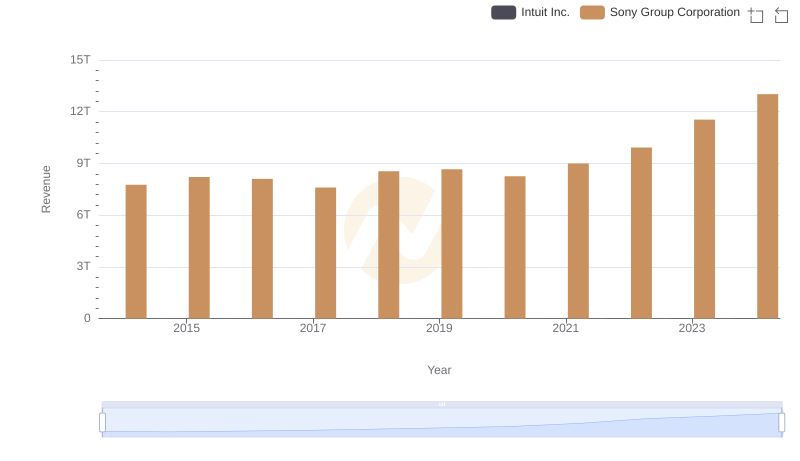
Annual Revenue Comparison: Intuit Inc. vs Sony Group Corporation
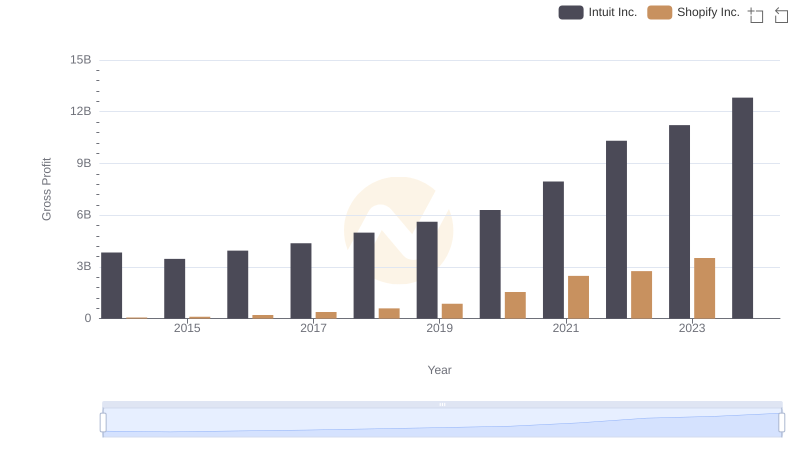
Gross Profit Comparison: Intuit Inc. and Shopify Inc. Trends
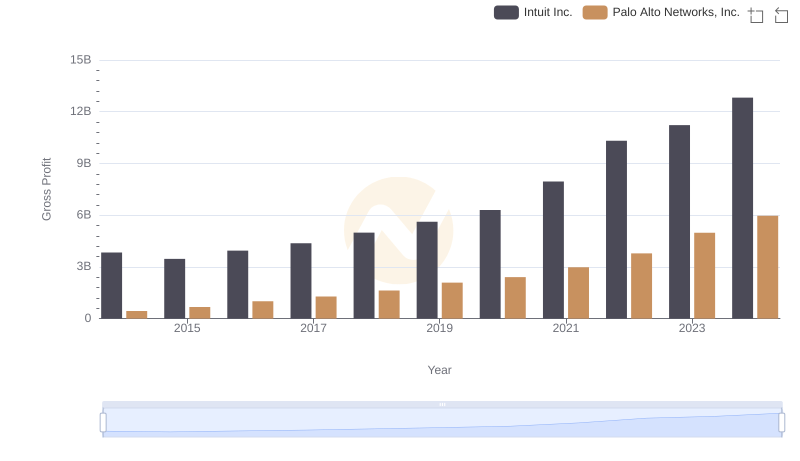
Who Generates Higher Gross Profit? Intuit Inc. or Palo Alto Networks, Inc.
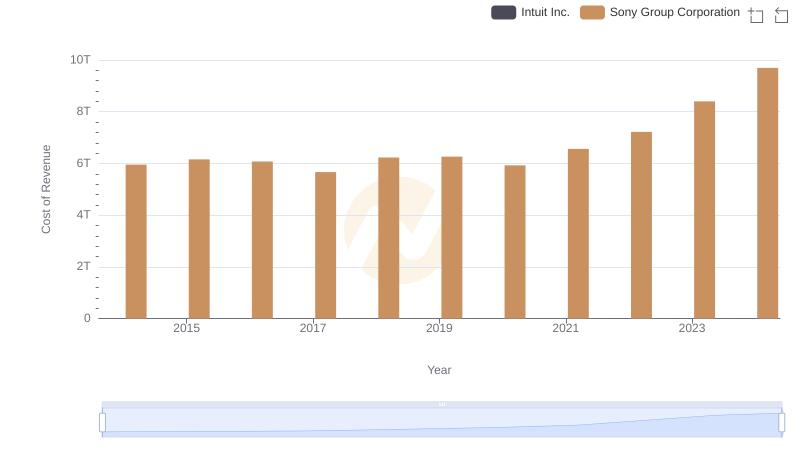
Cost of Revenue Trends: Intuit Inc. vs Sony Group Corporation
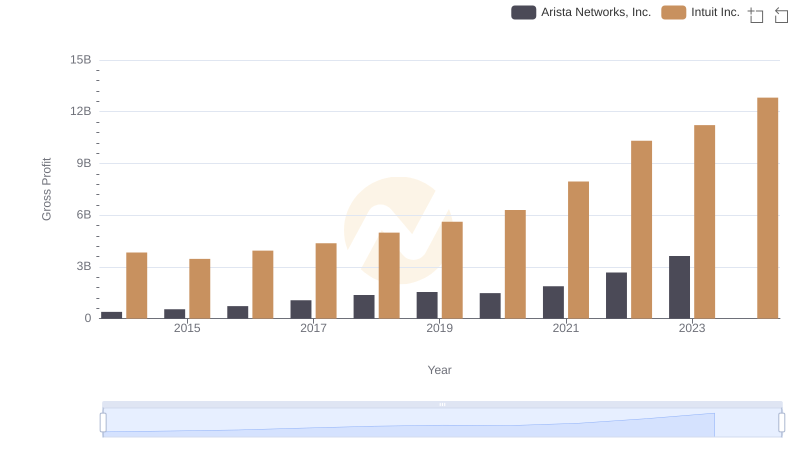
Intuit Inc. vs Arista Networks, Inc.: A Gross Profit Performance Breakdown
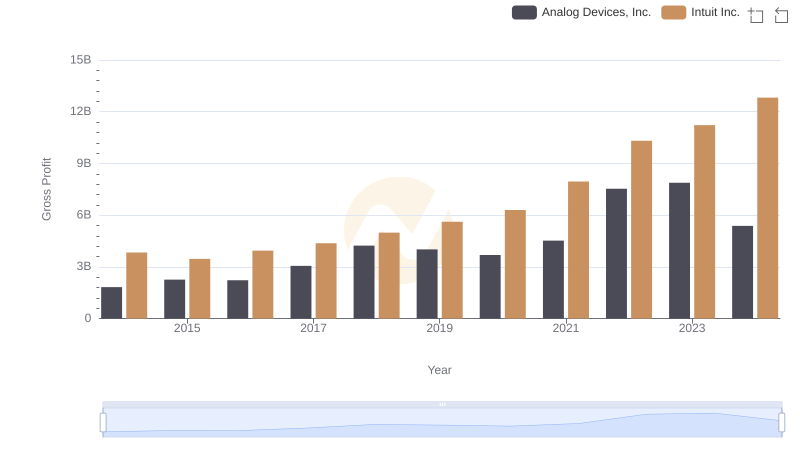
Who Generates Higher Gross Profit? Intuit Inc. or Analog Devices, Inc.
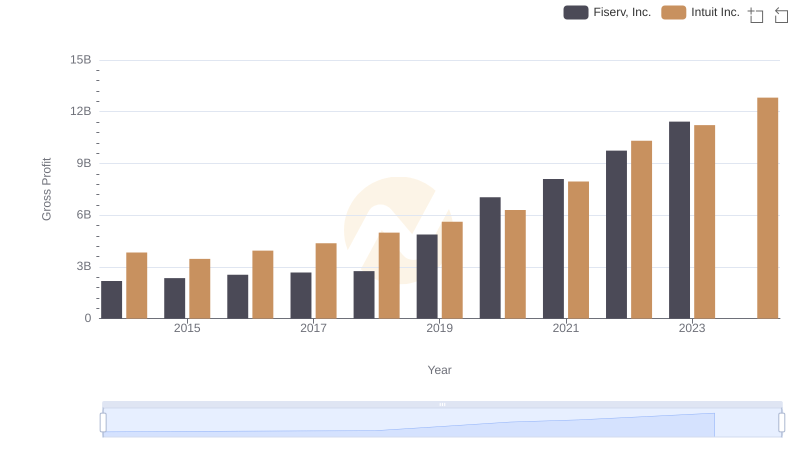
Who Generates Higher Gross Profit? Intuit Inc. or Fiserv, Inc.

Intuit Inc. vs Fiserv, Inc.: A Gross Profit Performance Breakdown
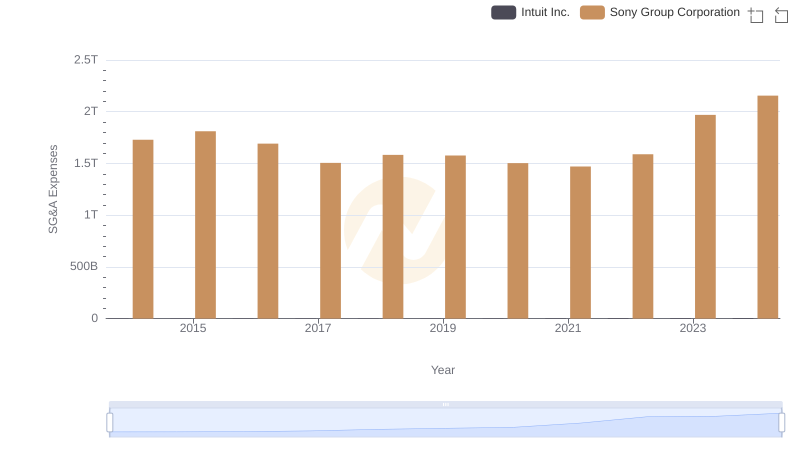
Who Optimizes SG&A Costs Better? Intuit Inc. or Sony Group Corporation
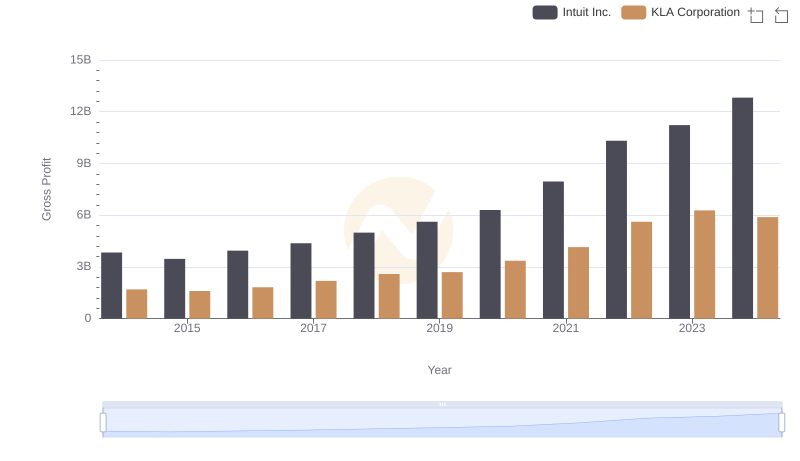
Intuit Inc. and KLA Corporation: A Detailed Gross Profit Analysis
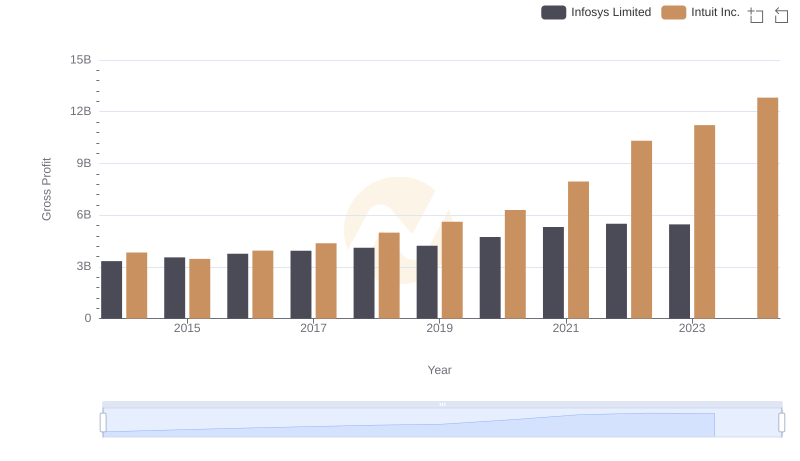
Gross Profit Trends Compared: Intuit Inc. vs Infosys Limited
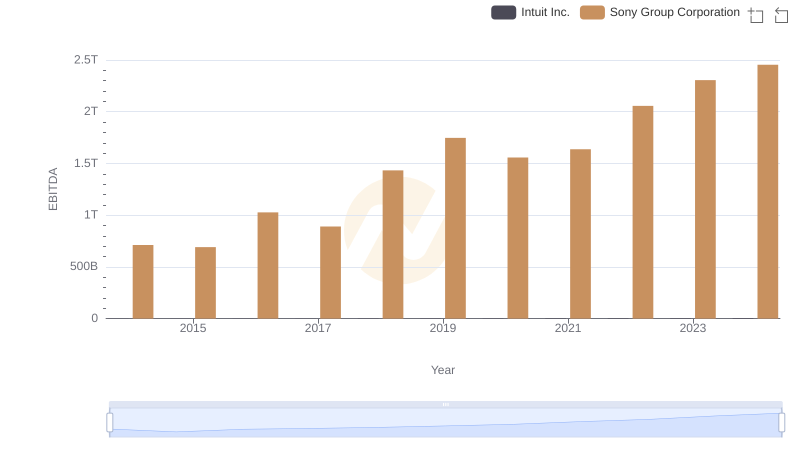
EBITDA Performance Review: Intuit Inc. vs Sony Group Corporation