| __timestamp | Fiserv, Inc. | Intuit Inc. |
|---|---|---|
| Wednesday, January 1, 2014 | 1614000000 | 1528000000 |
| Thursday, January 1, 2015 | 1728000000 | 970000000 |
| Friday, January 1, 2016 | 1856000000 | 1480000000 |
| Sunday, January 1, 2017 | 1961000000 | 1634000000 |
| Monday, January 1, 2018 | 2300000000 | 1839000000 |
| Tuesday, January 1, 2019 | 3126000000 | 2121000000 |
| Wednesday, January 1, 2020 | 4963000000 | 2430000000 |
| Friday, January 1, 2021 | 5392000000 | 2948000000 |
| Saturday, January 1, 2022 | 6636000000 | 3369000000 |
| Sunday, January 1, 2023 | 7813000000 | 4043000000 |
| Monday, January 1, 2024 | 5879000000 | 4581000000 |
Unlocking the unknown
In the ever-evolving landscape of financial technology, Intuit Inc. and Fiserv, Inc. have emerged as formidable players. Over the past decade, from 2014 to 2023, both companies have demonstrated impressive growth in their EBITDA, a key indicator of financial health and operational efficiency.
Fiserv, Inc. has shown a remarkable upward trajectory, with its EBITDA growing by nearly 384% from 2014 to 2023. This growth underscores Fiserv's strategic expansions and acquisitions, solidifying its position as a leader in financial services technology.
Intuit Inc., known for its innovative financial software solutions, has also experienced significant growth, with its EBITDA increasing by approximately 165% over the same period. Despite a slower start, Intuit's consistent performance highlights its resilience and adaptability in a competitive market.
As we look to the future, both companies are poised to continue their growth, driven by technological advancements and evolving consumer needs.
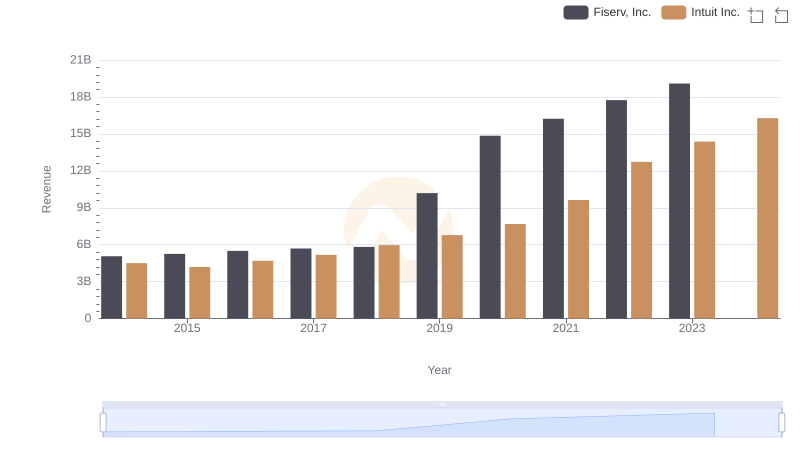
Comparing Revenue Performance: Intuit Inc. or Fiserv, Inc.?

Annual Revenue Comparison: Intuit Inc. vs Fiserv, Inc.
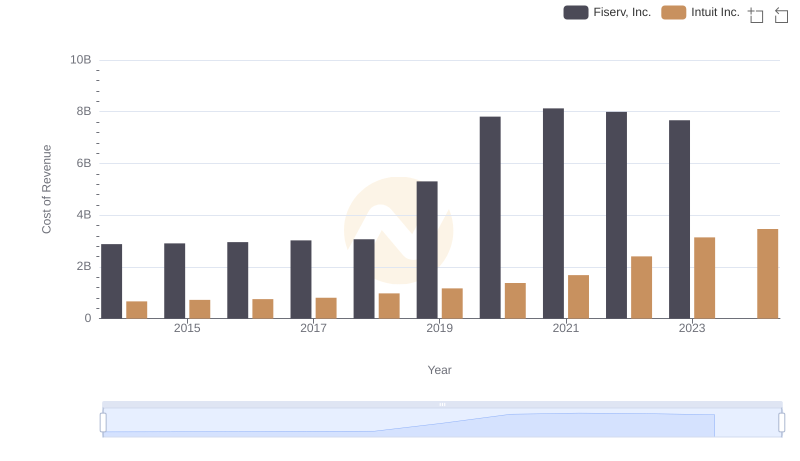
Cost Insights: Breaking Down Intuit Inc. and Fiserv, Inc.'s Expenses

Cost Insights: Breaking Down Intuit Inc. and Fiserv, Inc.'s Expenses
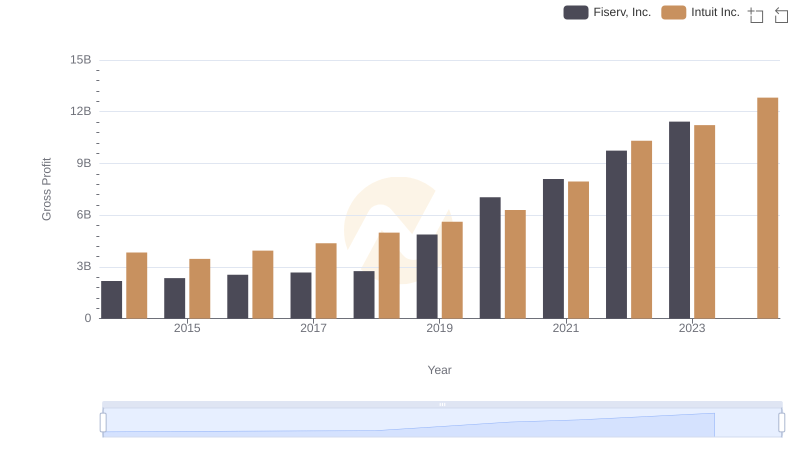
Who Generates Higher Gross Profit? Intuit Inc. or Fiserv, Inc.

Intuit Inc. vs Fiserv, Inc.: A Gross Profit Performance Breakdown

Cost Management Insights: SG&A Expenses for Intuit Inc. and Fiserv, Inc.
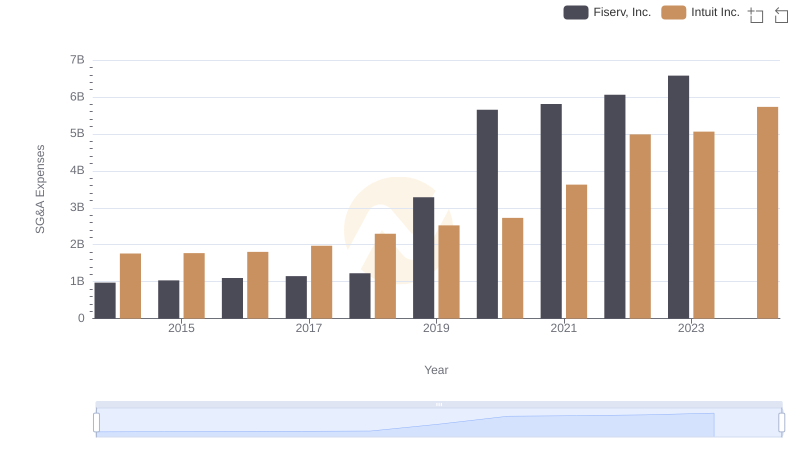
Intuit Inc. or Fiserv, Inc.: Who Manages SG&A Costs Better?
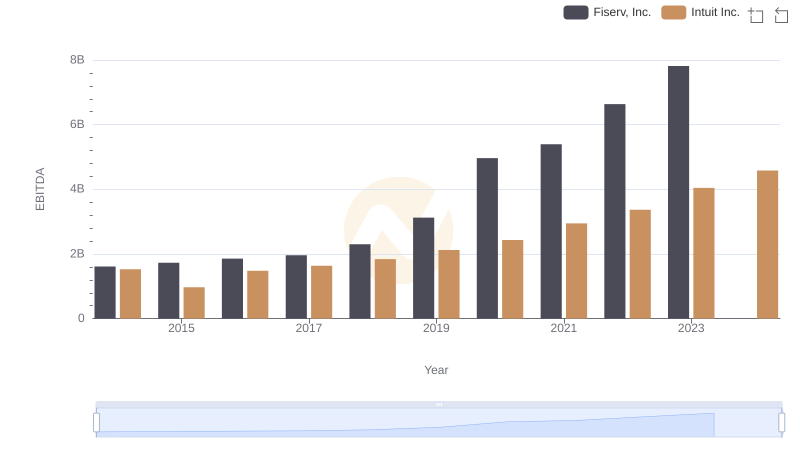
Comprehensive EBITDA Comparison: Intuit Inc. vs Fiserv, Inc.
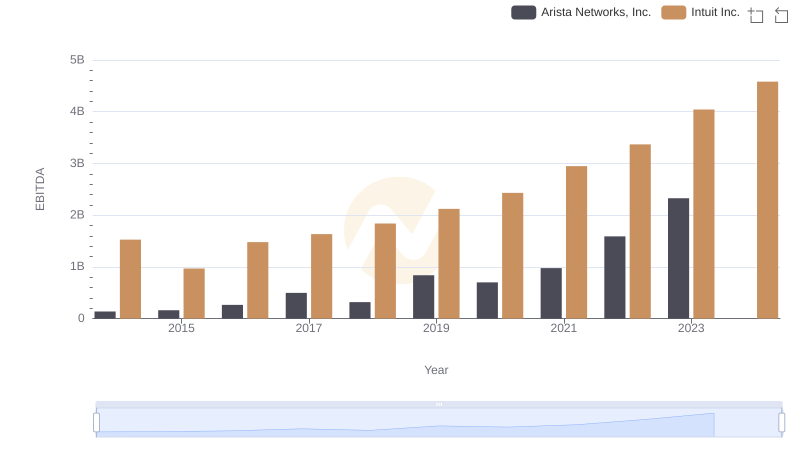
Intuit Inc. and Arista Networks, Inc.: A Detailed Examination of EBITDA Performance
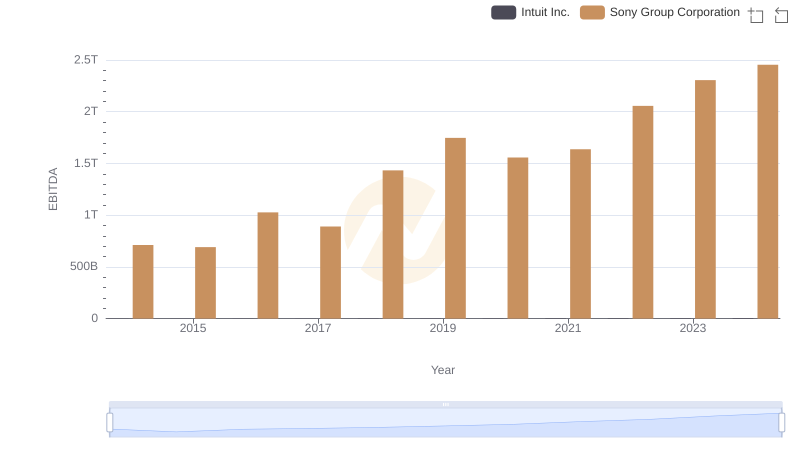
EBITDA Performance Review: Intuit Inc. vs Sony Group Corporation
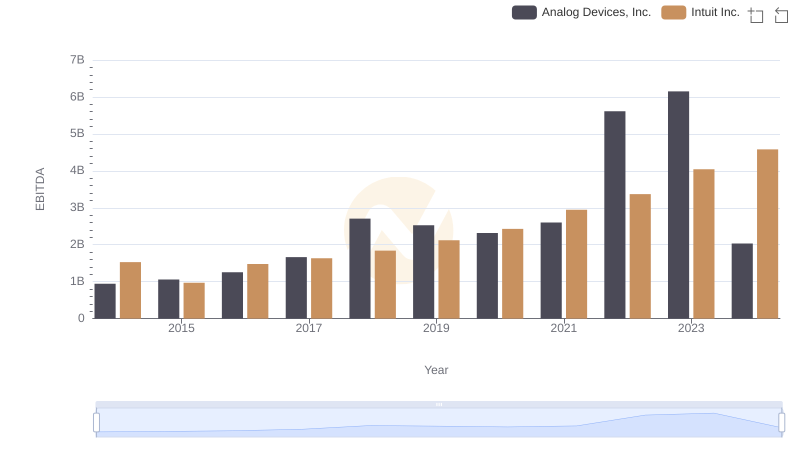
A Side-by-Side Analysis of EBITDA: Intuit Inc. and Analog Devices, Inc.