| __timestamp | Amphenol Corporation | Intuit Inc. |
|---|---|---|
| Wednesday, January 1, 2014 | 1221000000 | 1528000000 |
| Thursday, January 1, 2015 | 1292700000 | 970000000 |
| Friday, January 1, 2016 | 1430700000 | 1480000000 |
| Sunday, January 1, 2017 | 1671500000 | 1634000000 |
| Monday, January 1, 2018 | 1989800000 | 1839000000 |
| Tuesday, January 1, 2019 | 1925600000 | 2121000000 |
| Wednesday, January 1, 2020 | 1950100000 | 2430000000 |
| Friday, January 1, 2021 | 2500300000 | 2948000000 |
| Saturday, January 1, 2022 | 2988700000 | 3369000000 |
| Sunday, January 1, 2023 | 3000700000 | 4043000000 |
| Monday, January 1, 2024 | 3875100000 | 4581000000 |
Unleashing insights
In the ever-evolving landscape of corporate finance, EBITDA serves as a crucial indicator of a company's operational performance. Over the past decade, Intuit Inc. and Amphenol Corporation have demonstrated remarkable growth in this metric. From 2014 to 2024, Intuit's EBITDA surged by approximately 200%, reflecting its robust expansion and strategic initiatives. Meanwhile, Amphenol's EBITDA grew by around 160%, showcasing its resilience and adaptability in a competitive market.
This side-by-side analysis offers a compelling glimpse into the financial health and strategic prowess of these industry giants.
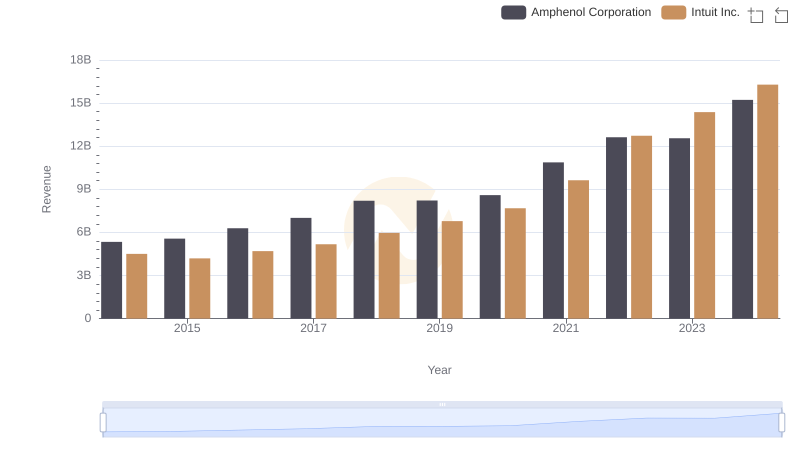
Revenue Insights: Intuit Inc. and Amphenol Corporation Performance Compared
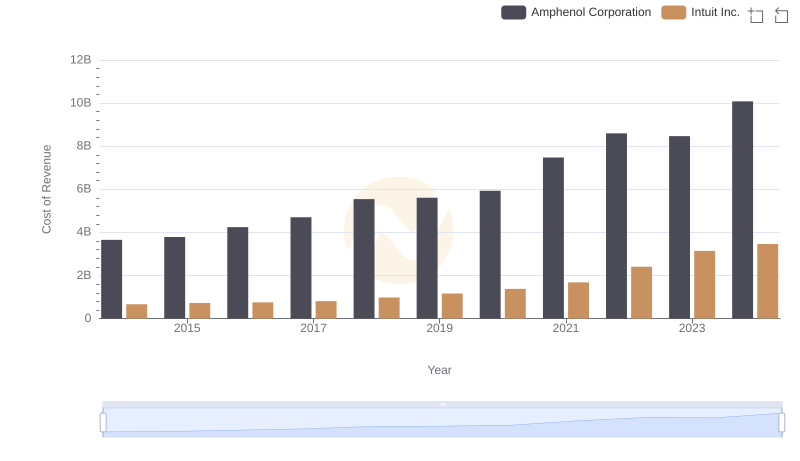
Analyzing Cost of Revenue: Intuit Inc. and Amphenol Corporation
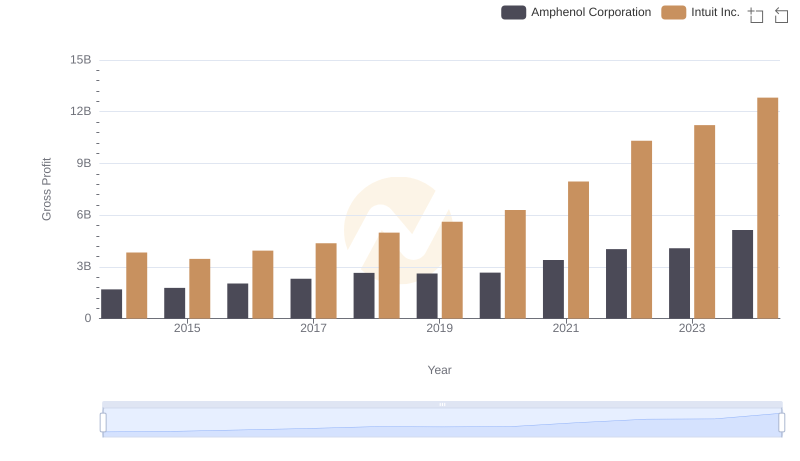
Gross Profit Analysis: Comparing Intuit Inc. and Amphenol Corporation
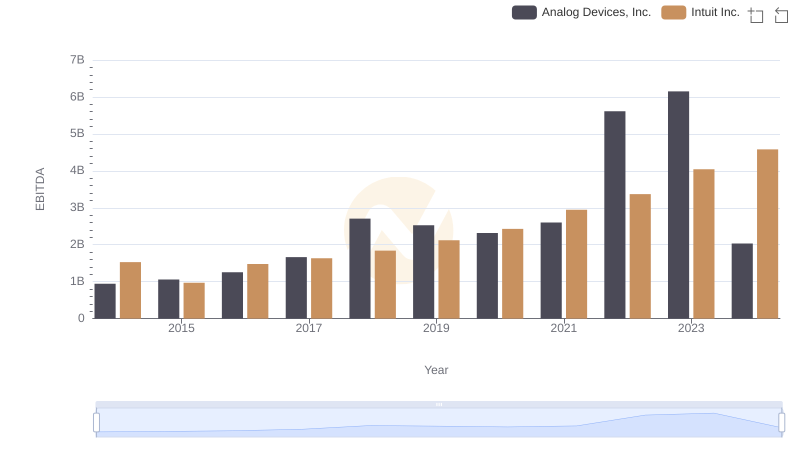
A Side-by-Side Analysis of EBITDA: Intuit Inc. and Analog Devices, Inc.
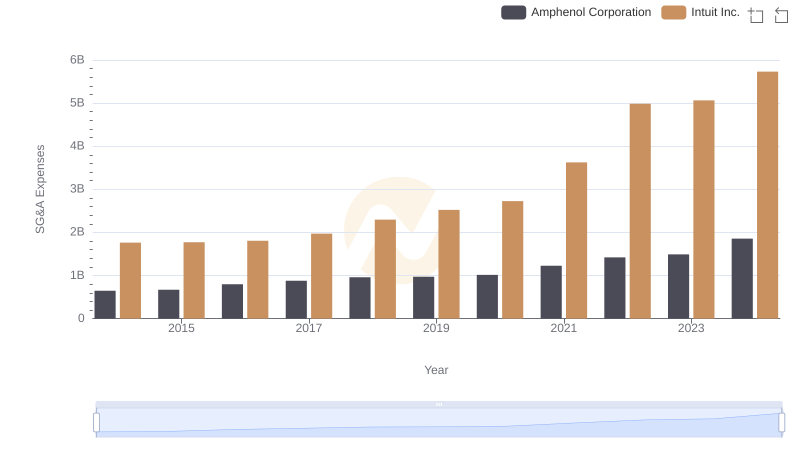
Who Optimizes SG&A Costs Better? Intuit Inc. or Amphenol Corporation
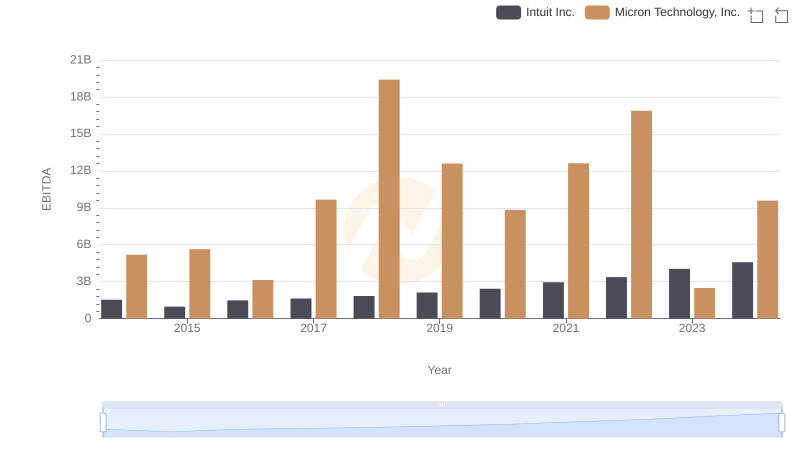
A Side-by-Side Analysis of EBITDA: Intuit Inc. and Micron Technology, Inc.
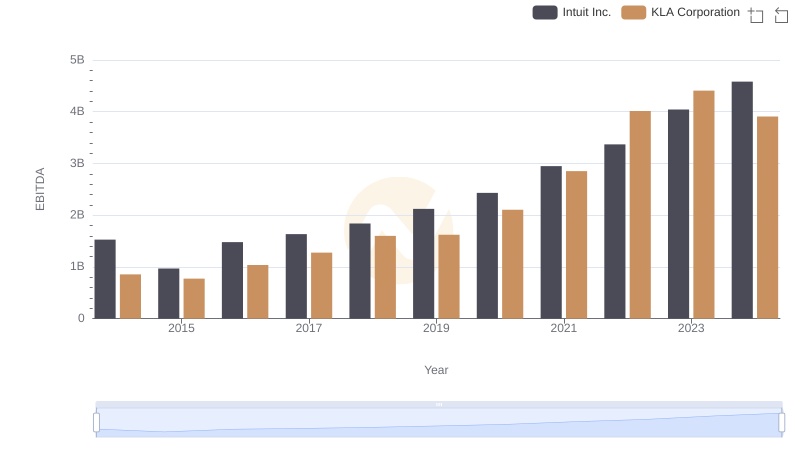
Intuit Inc. vs KLA Corporation: In-Depth EBITDA Performance Comparison
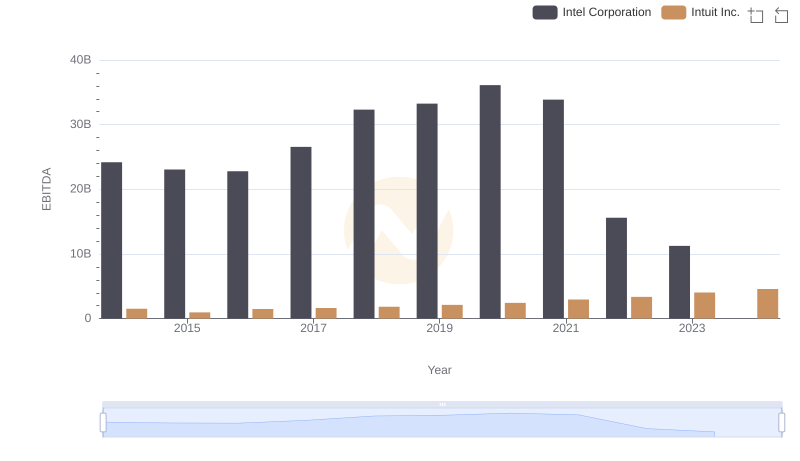
A Professional Review of EBITDA: Intuit Inc. Compared to Intel Corporation
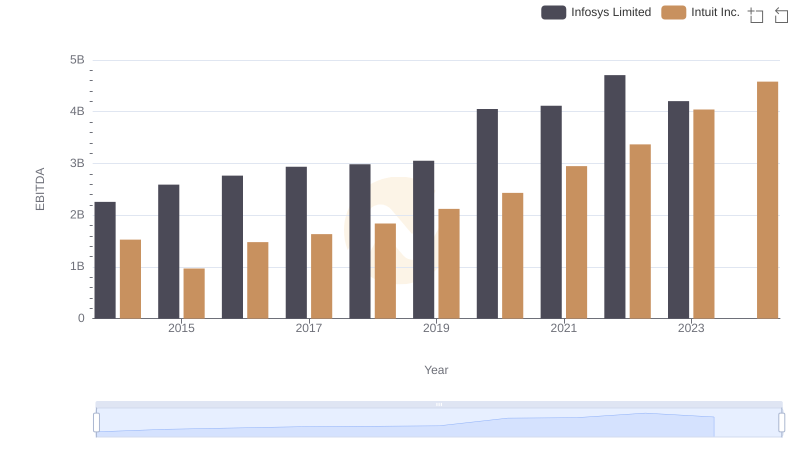
Intuit Inc. and Infosys Limited: A Detailed Examination of EBITDA Performance
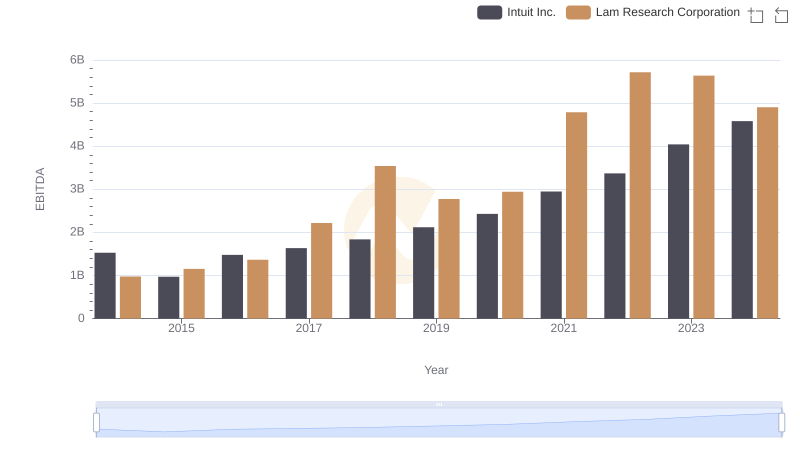
Intuit Inc. and Lam Research Corporation: A Detailed Examination of EBITDA Performance
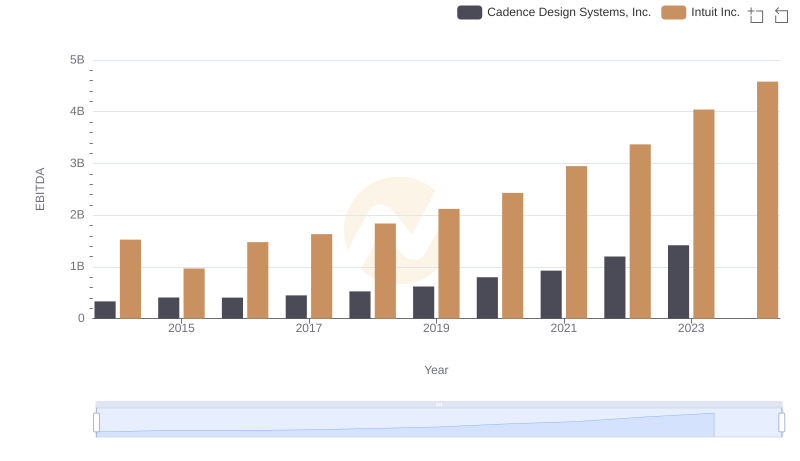
Comparative EBITDA Analysis: Intuit Inc. vs Cadence Design Systems, Inc.
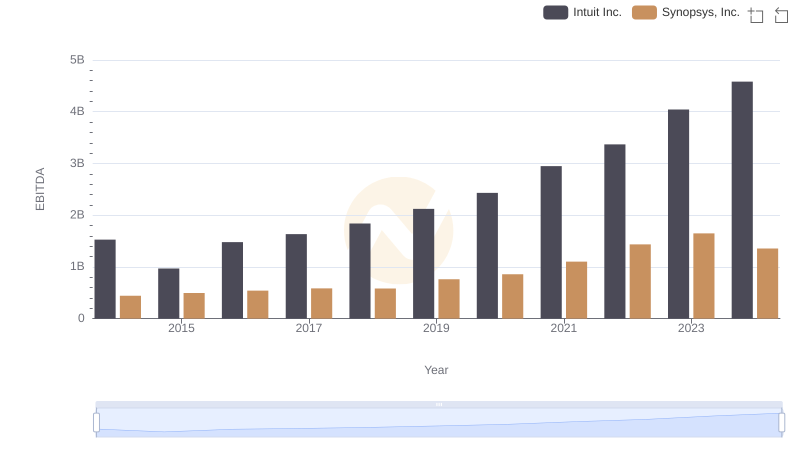
EBITDA Analysis: Evaluating Intuit Inc. Against Synopsys, Inc.