| __timestamp | Intuit Inc. | Sony Group Corporation |
|---|---|---|
| Wednesday, January 1, 2014 | 668000000 | 5956211000000 |
| Thursday, January 1, 2015 | 725000000 | 6158134000000 |
| Friday, January 1, 2016 | 752000000 | 6074652000000 |
| Sunday, January 1, 2017 | 809000000 | 5663154000000 |
| Monday, January 1, 2018 | 977000000 | 6230422000000 |
| Tuesday, January 1, 2019 | 1167000000 | 6263196000000 |
| Wednesday, January 1, 2020 | 1378000000 | 5925049000000 |
| Friday, January 1, 2021 | 1683000000 | 6561559000000 |
| Saturday, January 1, 2022 | 2406000000 | 7219841000000 |
| Sunday, January 1, 2023 | 3143000000 | 8398931000000 |
| Monday, January 1, 2024 | 3465000000 | 9695687000000 |
Unleashing the power of data
In the ever-evolving landscape of global business, Intuit Inc. and Sony Group Corporation stand as titans in their respective fields. Over the past decade, from 2014 to 2024, these companies have shown distinct trends in their cost of revenue, reflecting their strategic priorities and market dynamics.
Intuit Inc., a leader in financial software, has seen its cost of revenue grow by over 400% from 2014 to 2024. This steady increase, peaking at $3.47 billion in 2024, underscores Intuit's expanding market reach and investment in product development.
In contrast, Sony Group Corporation, a behemoth in electronics and entertainment, operates on a vastly different scale. Despite fluctuations, Sony's cost of revenue has surged by approximately 63% over the same period, reaching a staggering $9.70 trillion in 2024. This reflects Sony's diverse portfolio and global market penetration.
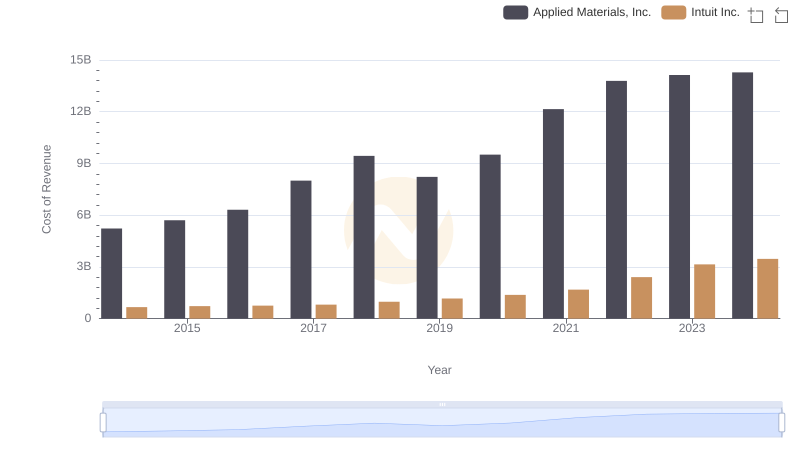
Cost of Revenue Comparison: Intuit Inc. vs Applied Materials, Inc.

Cost Insights: Breaking Down Intuit Inc. and Shopify Inc.'s Expenses
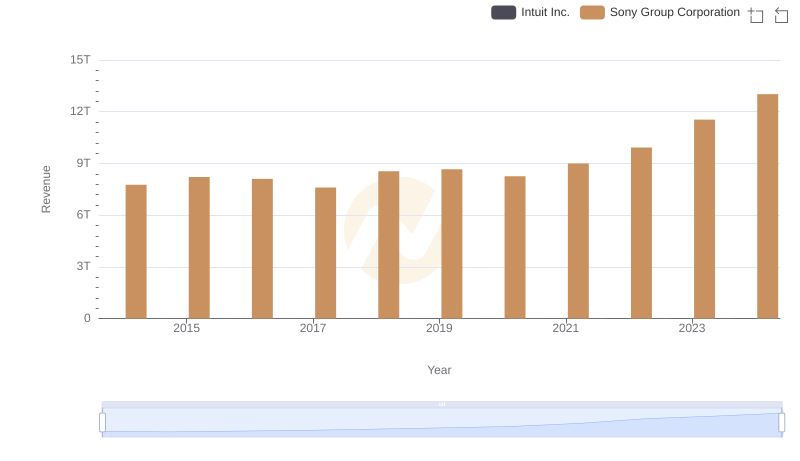
Annual Revenue Comparison: Intuit Inc. vs Sony Group Corporation
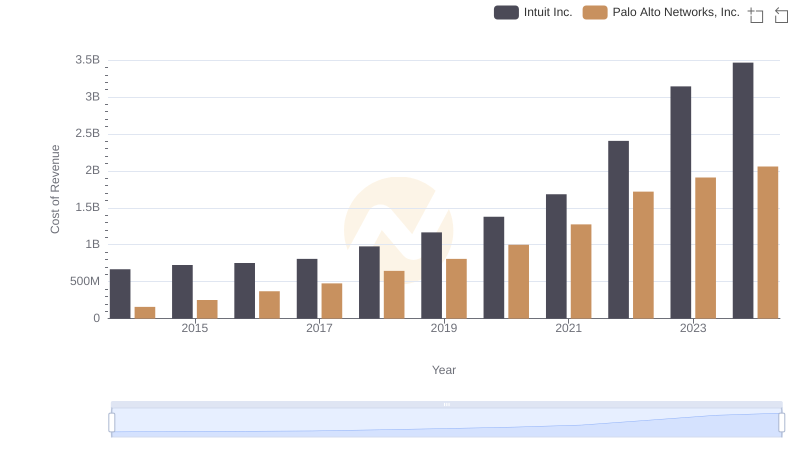
Cost Insights: Breaking Down Intuit Inc. and Palo Alto Networks, Inc.'s Expenses
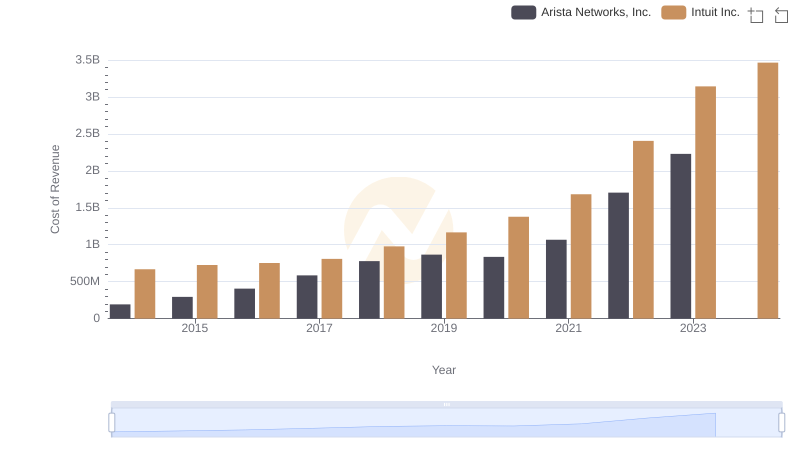
Cost of Revenue: Key Insights for Intuit Inc. and Arista Networks, Inc.
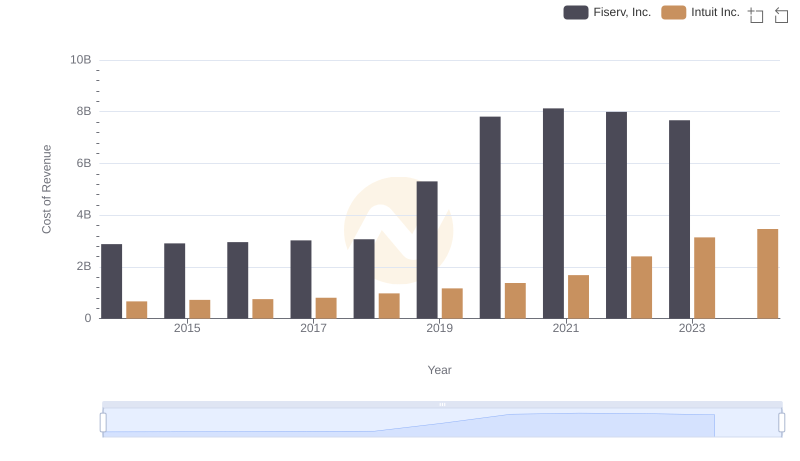
Cost Insights: Breaking Down Intuit Inc. and Fiserv, Inc.'s Expenses
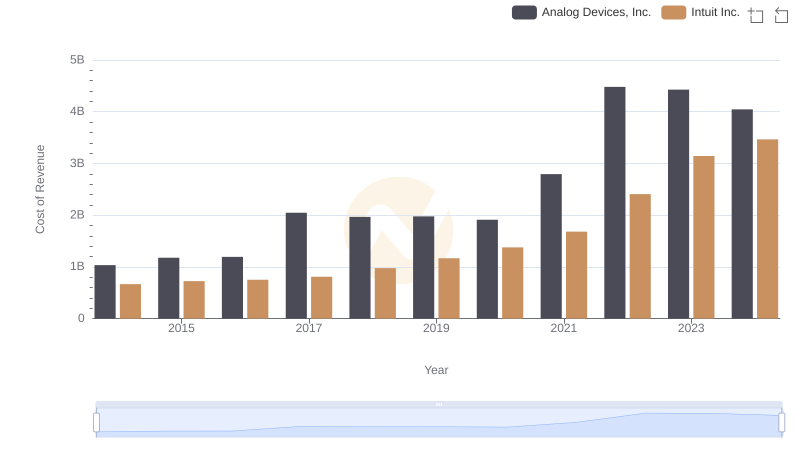
Cost Insights: Breaking Down Intuit Inc. and Analog Devices, Inc.'s Expenses

Cost Insights: Breaking Down Intuit Inc. and Fiserv, Inc.'s Expenses
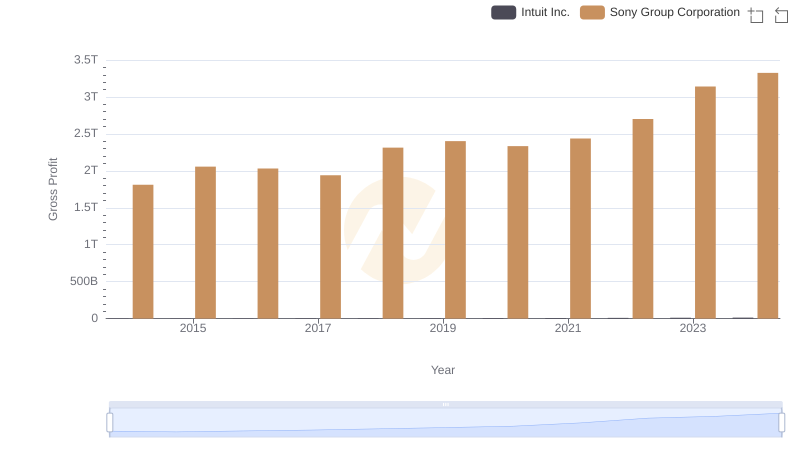
Gross Profit Analysis: Comparing Intuit Inc. and Sony Group Corporation
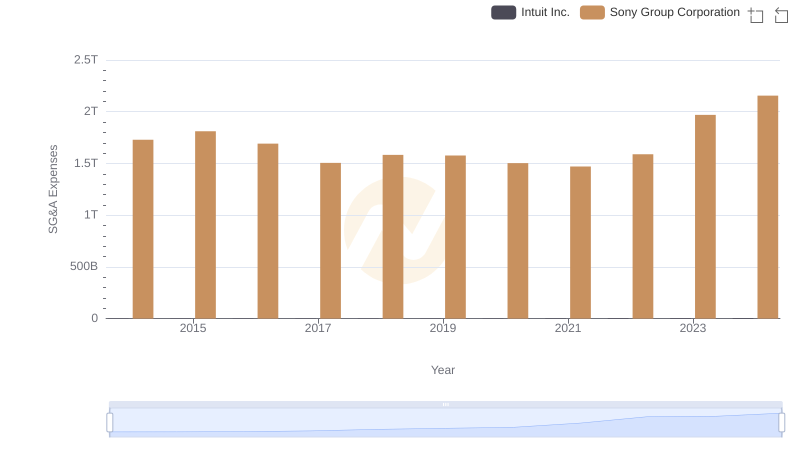
Who Optimizes SG&A Costs Better? Intuit Inc. or Sony Group Corporation
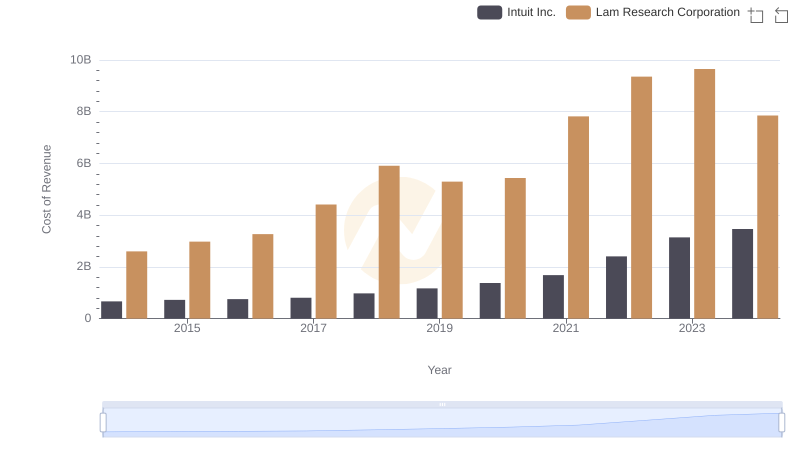
Analyzing Cost of Revenue: Intuit Inc. and Lam Research Corporation
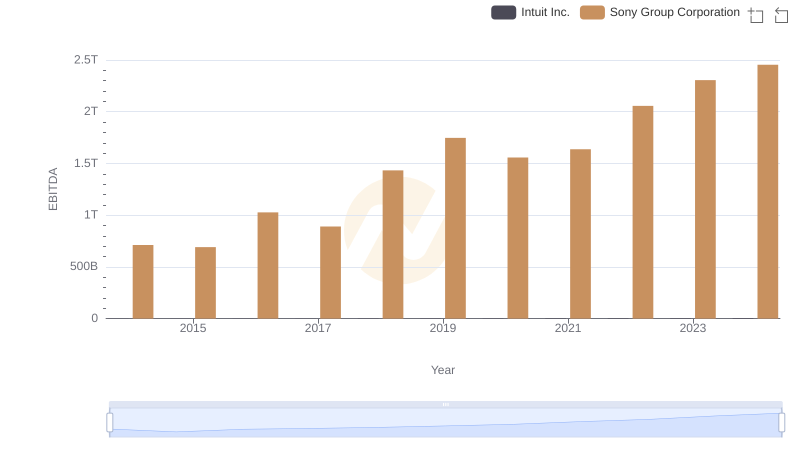
EBITDA Performance Review: Intuit Inc. vs Sony Group Corporation