| __timestamp | Arista Networks, Inc. | Intuit Inc. |
|---|---|---|
| Wednesday, January 1, 2014 | 137809000 | 1528000000 |
| Thursday, January 1, 2015 | 162832000 | 970000000 |
| Friday, January 1, 2016 | 265110000 | 1480000000 |
| Sunday, January 1, 2017 | 498180000 | 1634000000 |
| Monday, January 1, 2018 | 318202000 | 1839000000 |
| Tuesday, January 1, 2019 | 838623000 | 2121000000 |
| Wednesday, January 1, 2020 | 699684000 | 2430000000 |
| Friday, January 1, 2021 | 975073000 | 2948000000 |
| Saturday, January 1, 2022 | 1589806000 | 3369000000 |
| Sunday, January 1, 2023 | 2327879000 | 4043000000 |
| Monday, January 1, 2024 | 2944616000 | 4581000000 |
Unveiling the hidden dimensions of data
In the ever-evolving landscape of technology, Intuit Inc. and Arista Networks, Inc. have emerged as formidable players. Over the past decade, these companies have demonstrated remarkable growth in their EBITDA, a key indicator of financial health. From 2014 to 2023, Intuit's EBITDA surged by approximately 165%, reflecting its robust business model and strategic acquisitions. Meanwhile, Arista Networks showcased an even more impressive trajectory, with a staggering increase of over 1,500% in the same period, underscoring its dominance in the networking sector.
While Intuit's steady climb to a projected $4.58 billion in 2024 highlights its resilience, Arista's meteoric rise to $2.33 billion in 2023 is a testament to its innovative edge. However, the absence of data for Arista in 2024 leaves room for speculation. As these titans continue to innovate, their financial journeys offer valuable insights into the future of tech.
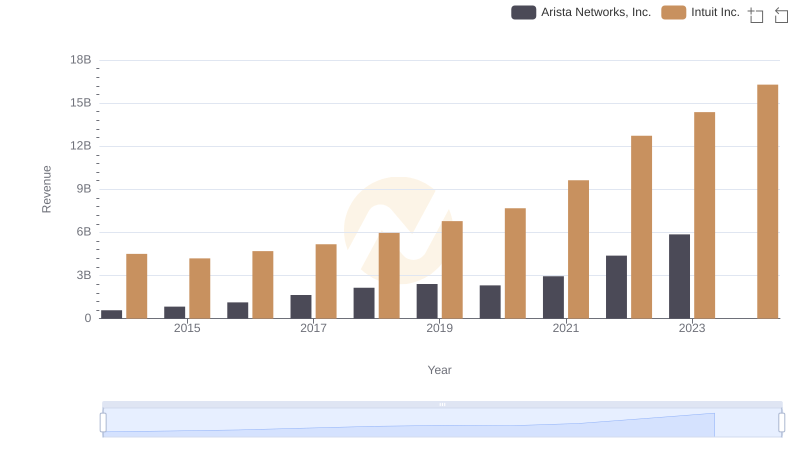
Annual Revenue Comparison: Intuit Inc. vs Arista Networks, Inc.
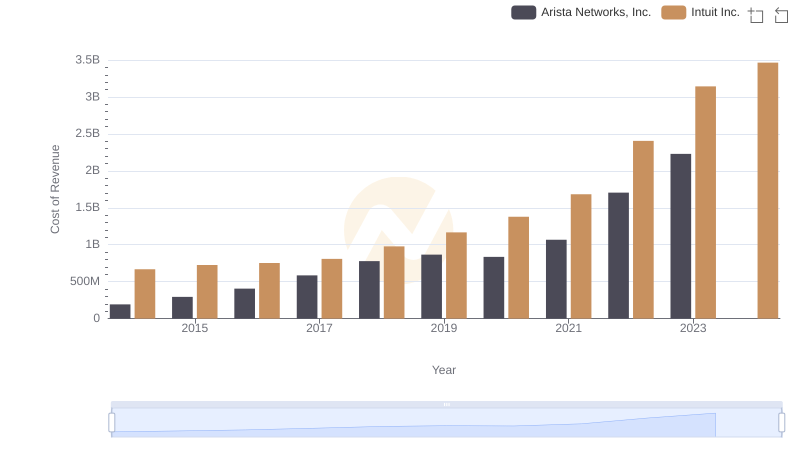
Cost of Revenue: Key Insights for Intuit Inc. and Arista Networks, Inc.
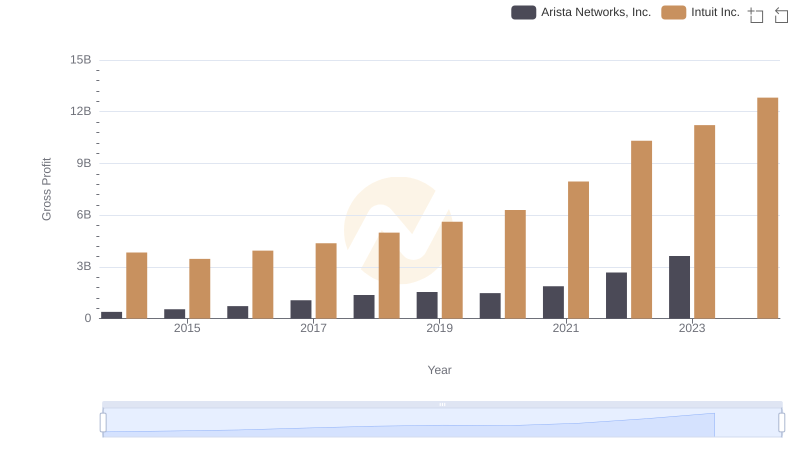
Intuit Inc. vs Arista Networks, Inc.: A Gross Profit Performance Breakdown
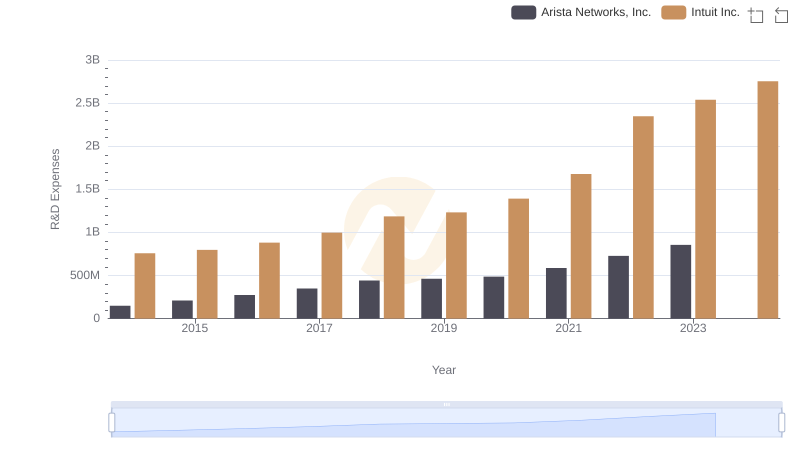
Intuit Inc. or Arista Networks, Inc.: Who Invests More in Innovation?
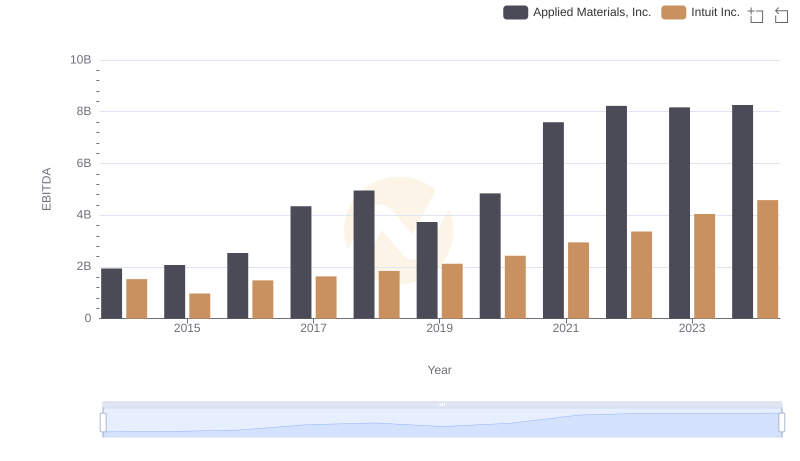
EBITDA Performance Review: Intuit Inc. vs Applied Materials, Inc.
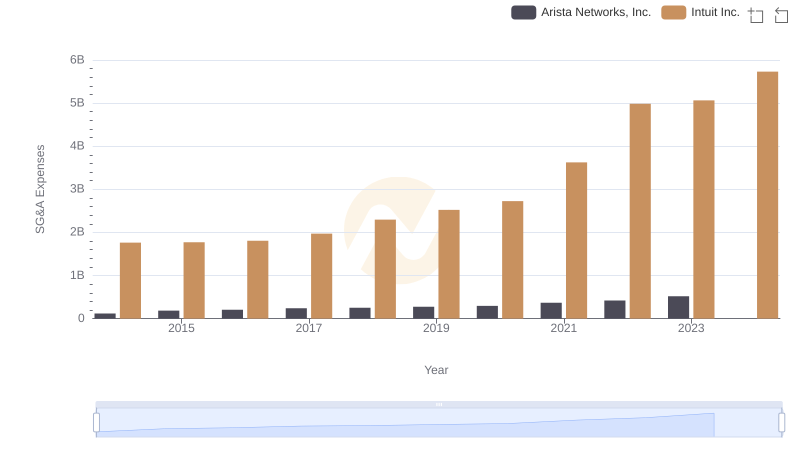
Operational Costs Compared: SG&A Analysis of Intuit Inc. and Arista Networks, Inc.
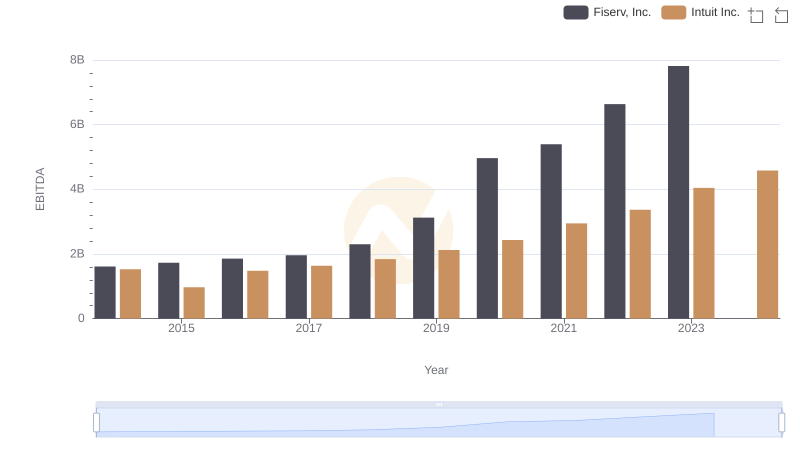
Comprehensive EBITDA Comparison: Intuit Inc. vs Fiserv, Inc.

Comprehensive EBITDA Comparison: Intuit Inc. vs Fiserv, Inc.
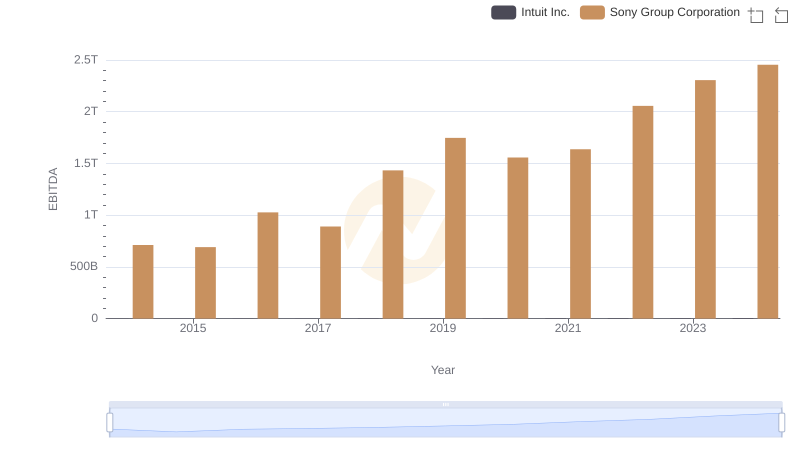
EBITDA Performance Review: Intuit Inc. vs Sony Group Corporation
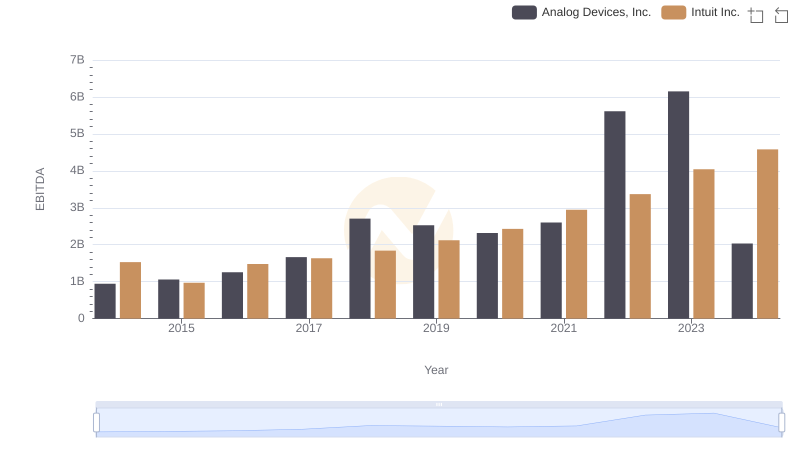
A Side-by-Side Analysis of EBITDA: Intuit Inc. and Analog Devices, Inc.
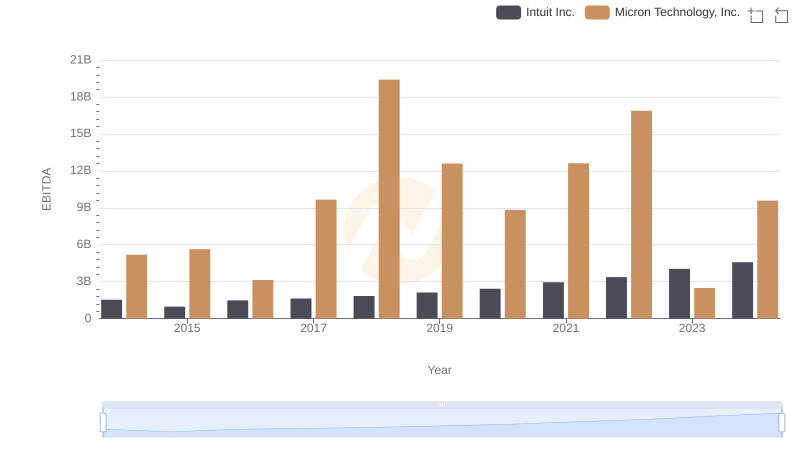
A Side-by-Side Analysis of EBITDA: Intuit Inc. and Micron Technology, Inc.
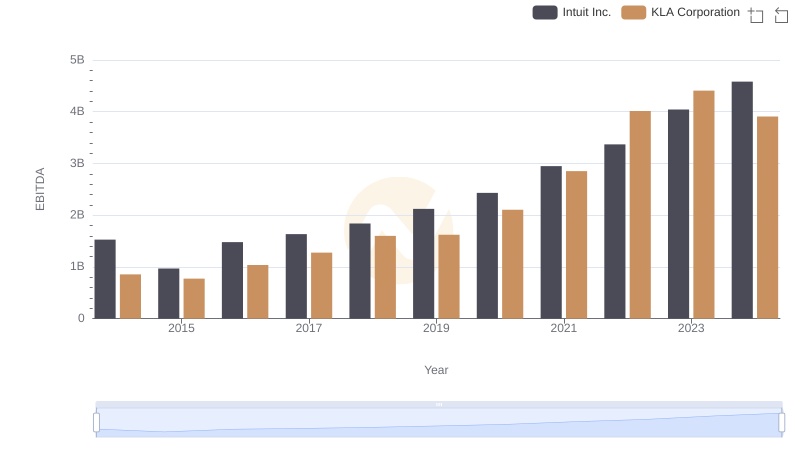
Intuit Inc. vs KLA Corporation: In-Depth EBITDA Performance Comparison