| __timestamp | Intuit Inc. | KLA Corporation |
|---|---|---|
| Wednesday, January 1, 2014 | 1528000000 | 855142000 |
| Thursday, January 1, 2015 | 970000000 | 773476000 |
| Friday, January 1, 2016 | 1480000000 | 1036277000 |
| Sunday, January 1, 2017 | 1634000000 | 1276261000 |
| Monday, January 1, 2018 | 1839000000 | 1599878000 |
| Tuesday, January 1, 2019 | 2121000000 | 1620873000 |
| Wednesday, January 1, 2020 | 2430000000 | 2104221000 |
| Friday, January 1, 2021 | 2948000000 | 2851117000 |
| Saturday, January 1, 2022 | 3369000000 | 4012920000 |
| Sunday, January 1, 2023 | 4043000000 | 4406901000 |
| Monday, January 1, 2024 | 4581000000 | 3906779000 |
Cracking the code
In the ever-evolving landscape of technology and innovation, Intuit Inc. and KLA Corporation have emerged as formidable players. Over the past decade, from 2014 to 2024, these giants have showcased remarkable growth in their EBITDA, a key indicator of financial health and operational efficiency.
Intuit Inc. has demonstrated a robust upward trajectory, with its EBITDA growing by approximately 200% from 2014 to 2024. Starting at a modest 1.5 billion in 2014, it soared to an impressive 4.6 billion by 2024. Meanwhile, KLA Corporation, not to be outdone, experienced a similar growth pattern, with its EBITDA increasing by over 350% during the same period, peaking at 4.4 billion in 2023.
While both companies have shown resilience and adaptability, KLA Corporation's EBITDA surpassed Intuit's in 2022, highlighting its strategic advancements in the semiconductor industry. However, Intuit reclaimed its lead in 2024, underscoring its dominance in financial software solutions. This dynamic interplay between the two companies offers a fascinating glimpse into the competitive nature of the tech industry.
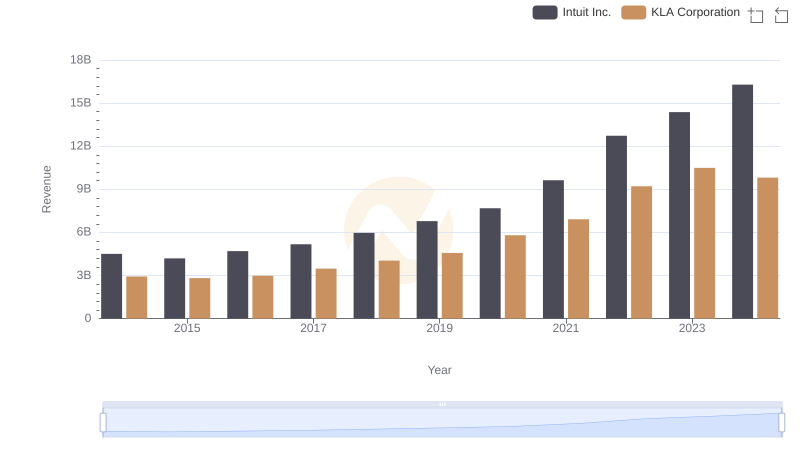
Revenue Showdown: Intuit Inc. vs KLA Corporation
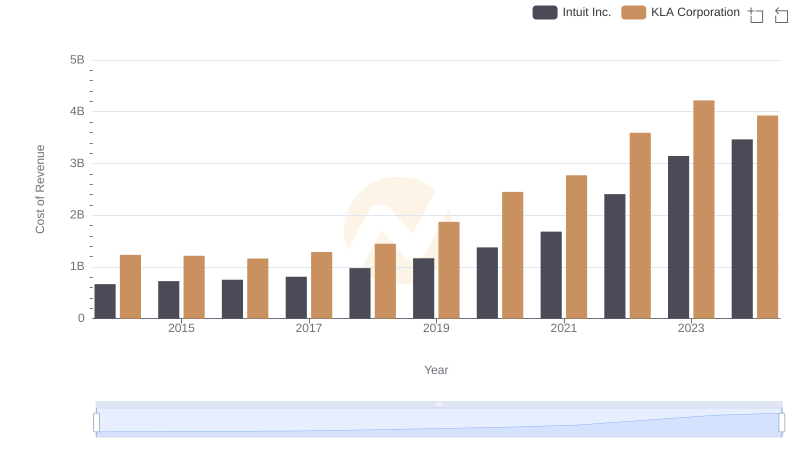
Cost of Revenue Trends: Intuit Inc. vs KLA Corporation
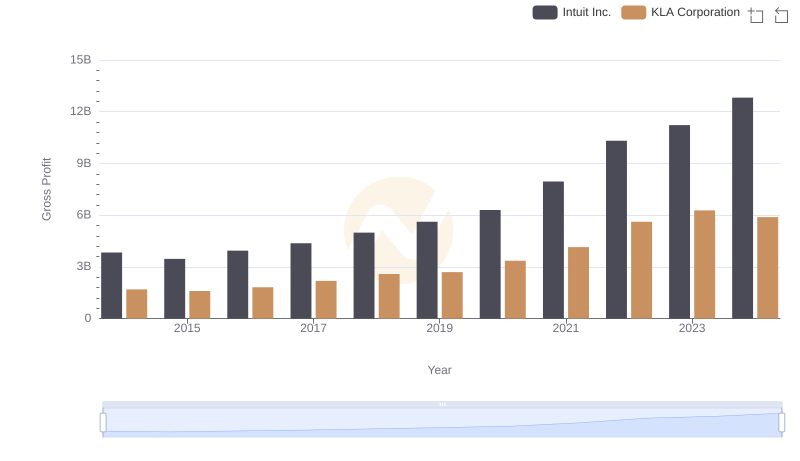
Intuit Inc. and KLA Corporation: A Detailed Gross Profit Analysis
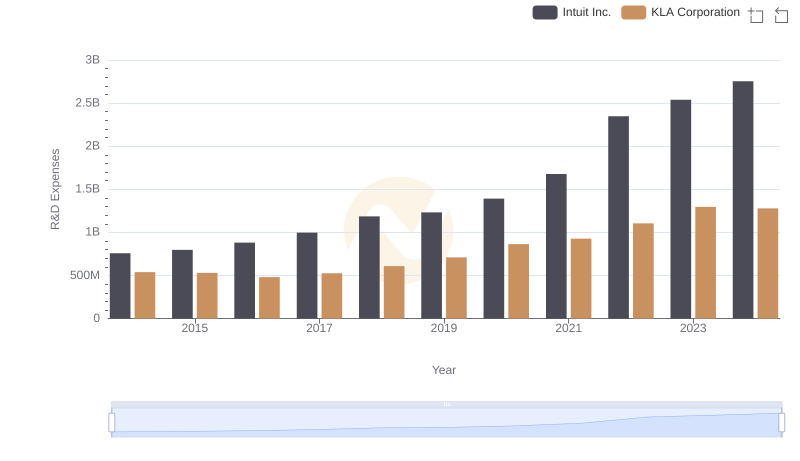
Research and Development: Comparing Key Metrics for Intuit Inc. and KLA Corporation
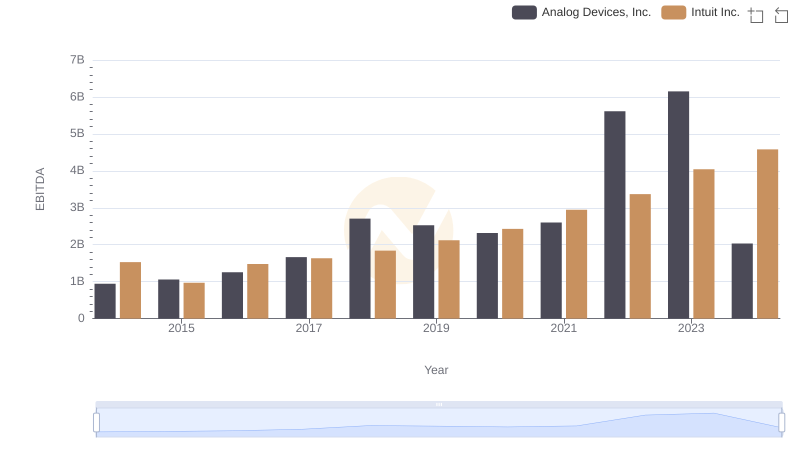
A Side-by-Side Analysis of EBITDA: Intuit Inc. and Analog Devices, Inc.
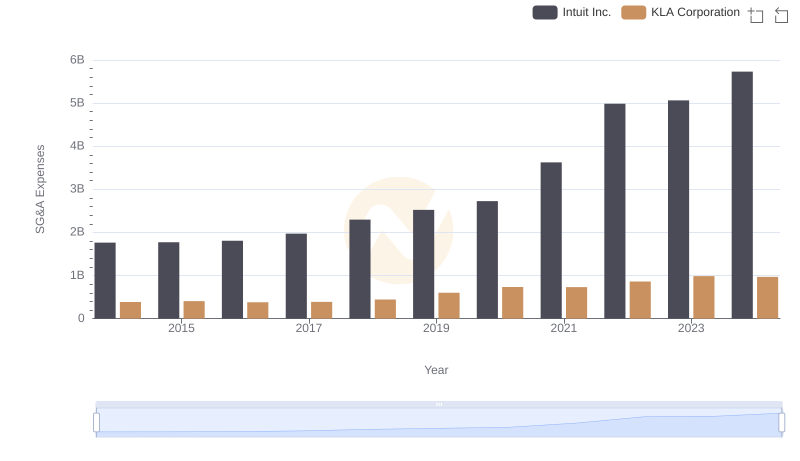
Intuit Inc. and KLA Corporation: SG&A Spending Patterns Compared
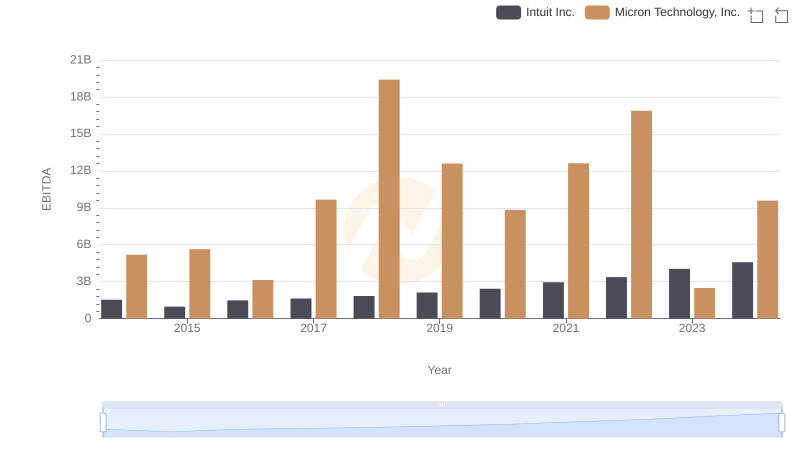
A Side-by-Side Analysis of EBITDA: Intuit Inc. and Micron Technology, Inc.
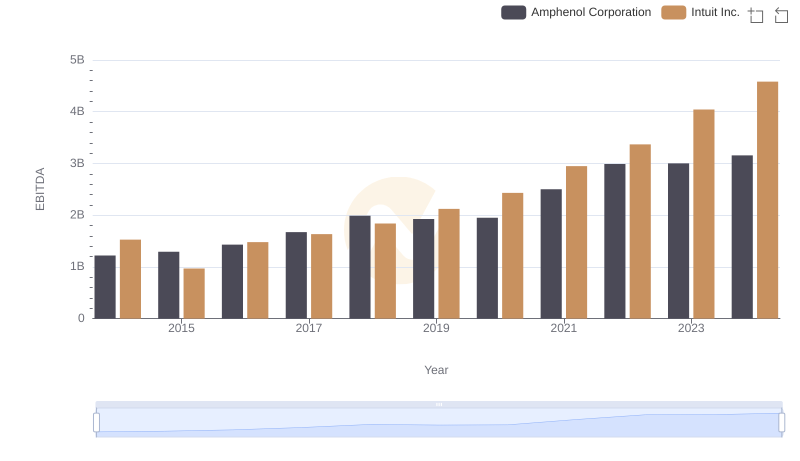
A Side-by-Side Analysis of EBITDA: Intuit Inc. and Amphenol Corporation
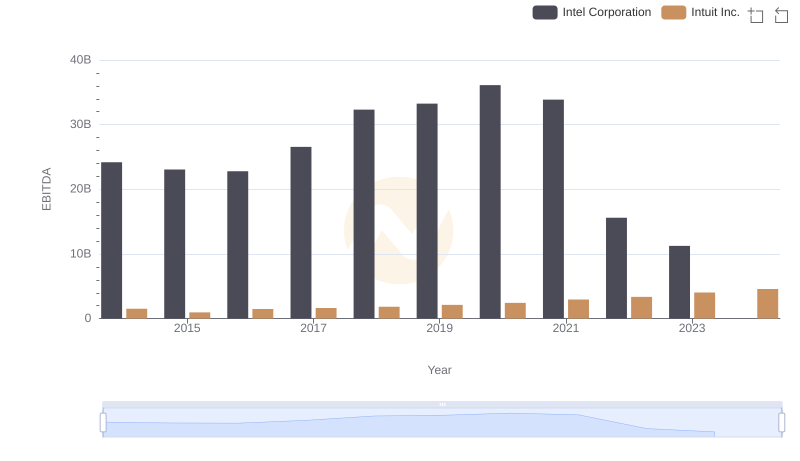
A Professional Review of EBITDA: Intuit Inc. Compared to Intel Corporation
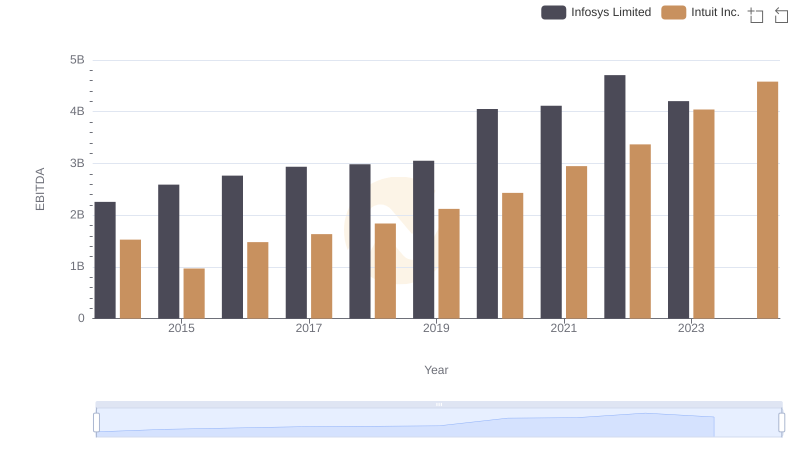
Intuit Inc. and Infosys Limited: A Detailed Examination of EBITDA Performance
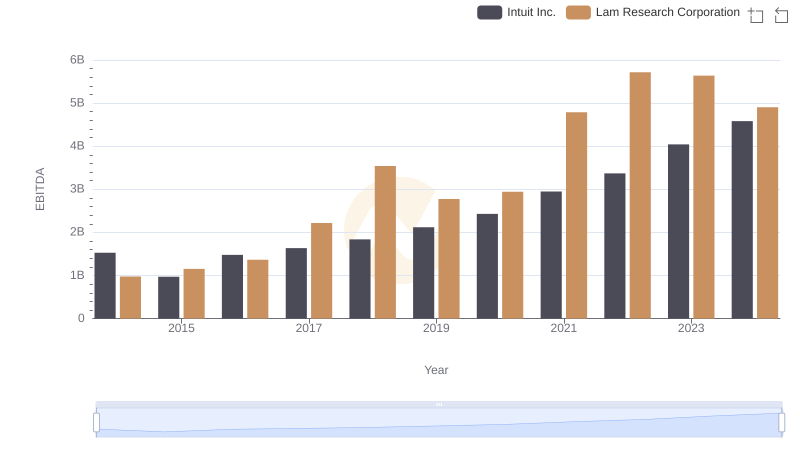
Intuit Inc. and Lam Research Corporation: A Detailed Examination of EBITDA Performance
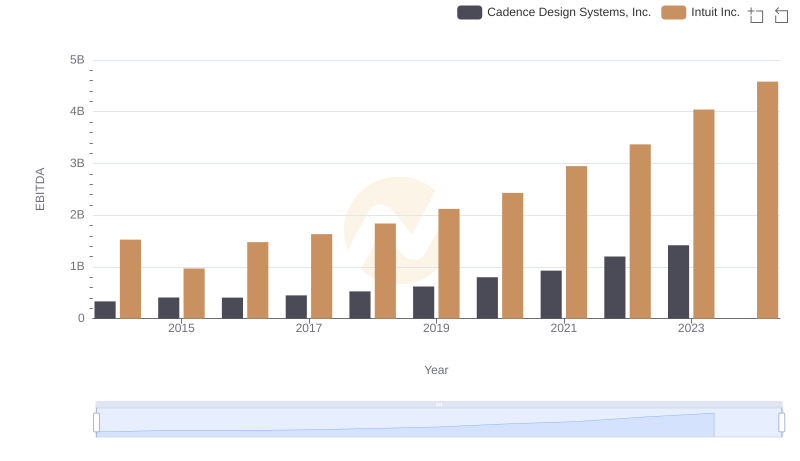
Comparative EBITDA Analysis: Intuit Inc. vs Cadence Design Systems, Inc.