| __timestamp | Fiserv, Inc. | Intuit Inc. |
|---|---|---|
| Wednesday, January 1, 2014 | 1614000000 | 1528000000 |
| Thursday, January 1, 2015 | 1728000000 | 970000000 |
| Friday, January 1, 2016 | 1856000000 | 1480000000 |
| Sunday, January 1, 2017 | 1961000000 | 1634000000 |
| Monday, January 1, 2018 | 2300000000 | 1839000000 |
| Tuesday, January 1, 2019 | 3126000000 | 2121000000 |
| Wednesday, January 1, 2020 | 4963000000 | 2430000000 |
| Friday, January 1, 2021 | 5392000000 | 2948000000 |
| Saturday, January 1, 2022 | 6636000000 | 3369000000 |
| Sunday, January 1, 2023 | 7813000000 | 4043000000 |
| Monday, January 1, 2024 | 5879000000 | 4581000000 |
Unlocking the unknown
In the ever-evolving landscape of financial technology, Intuit Inc. and Fiserv, Inc. have emerged as titans, showcasing remarkable growth in EBITDA over the past decade. From 2014 to 2023, Fiserv's EBITDA surged by an impressive 384%, reflecting its strategic expansions and acquisitions. Meanwhile, Intuit's EBITDA grew by 165%, driven by its innovative solutions in personal finance and small business management.
Starting in 2014, Fiserv led with a 5% higher EBITDA than Intuit. By 2023, Fiserv's EBITDA was nearly double that of Intuit, highlighting its aggressive market strategies. Notably, 2020 marked a pivotal year for both companies, with Fiserv's EBITDA jumping by 59% and Intuit's by 15% compared to the previous year.
While Intuit's 2024 data is available, Fiserv's is notably absent, leaving room for speculation on its future trajectory.
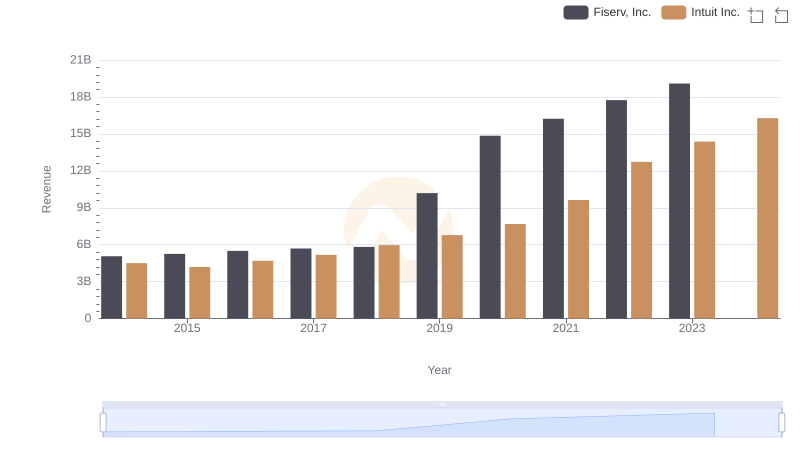
Comparing Revenue Performance: Intuit Inc. or Fiserv, Inc.?

Annual Revenue Comparison: Intuit Inc. vs Fiserv, Inc.
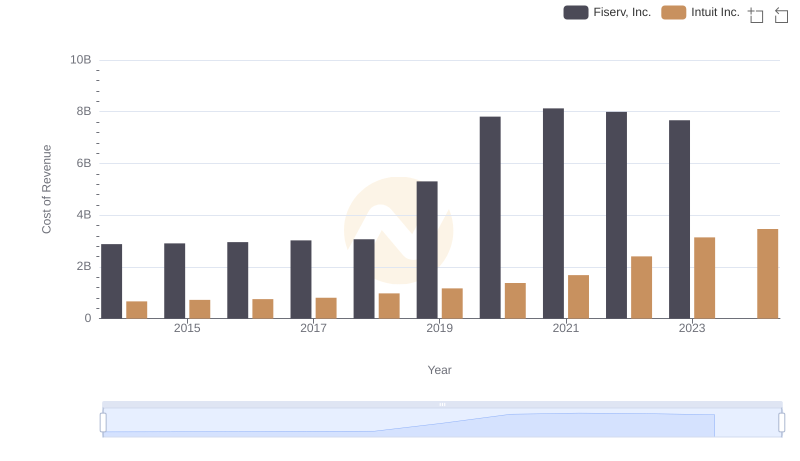
Cost Insights: Breaking Down Intuit Inc. and Fiserv, Inc.'s Expenses

Cost Insights: Breaking Down Intuit Inc. and Fiserv, Inc.'s Expenses
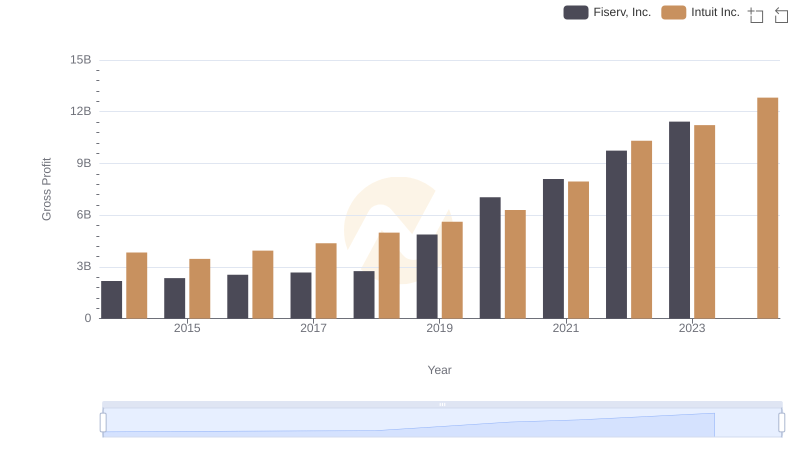
Who Generates Higher Gross Profit? Intuit Inc. or Fiserv, Inc.

Intuit Inc. vs Fiserv, Inc.: A Gross Profit Performance Breakdown
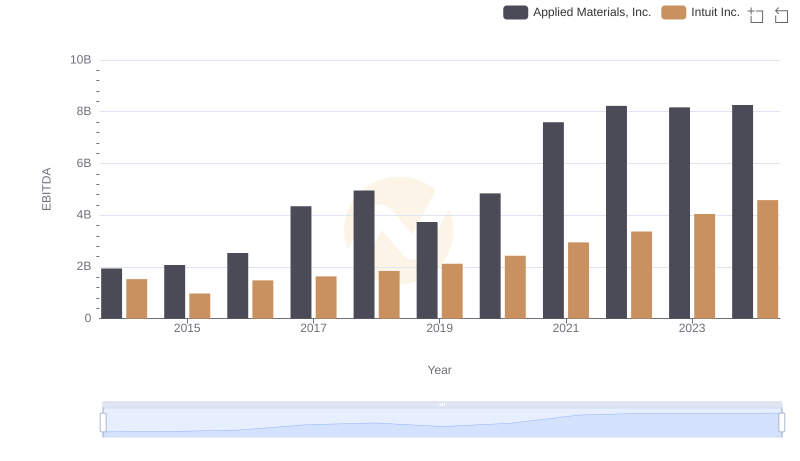
EBITDA Performance Review: Intuit Inc. vs Applied Materials, Inc.

Cost Management Insights: SG&A Expenses for Intuit Inc. and Fiserv, Inc.
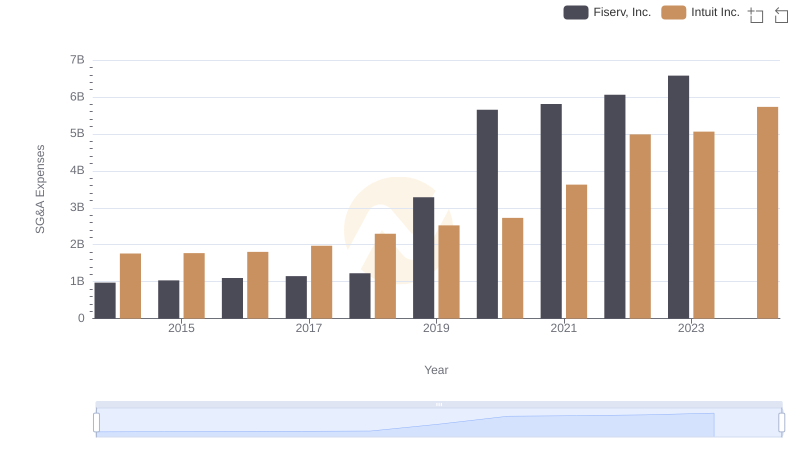
Intuit Inc. or Fiserv, Inc.: Who Manages SG&A Costs Better?
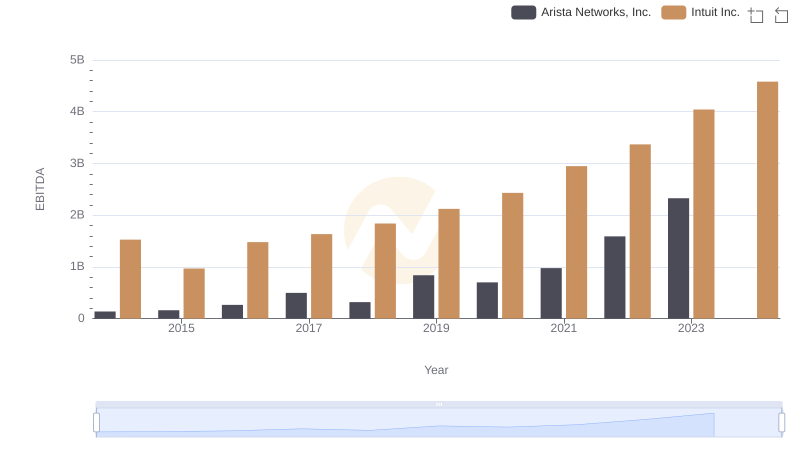
Intuit Inc. and Arista Networks, Inc.: A Detailed Examination of EBITDA Performance
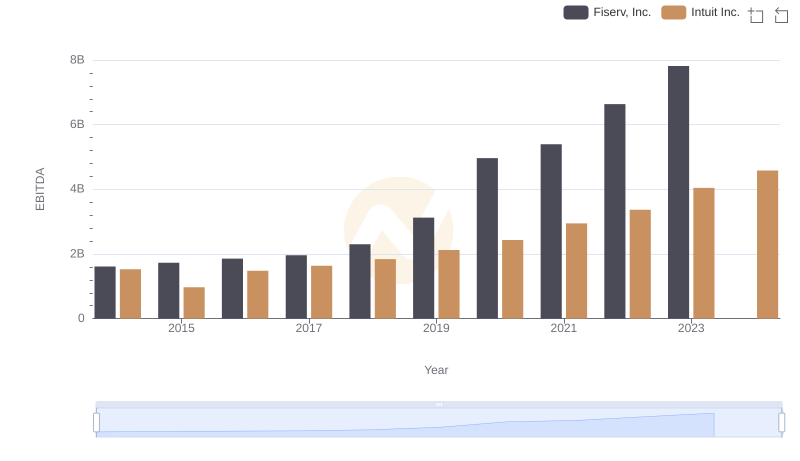
Comprehensive EBITDA Comparison: Intuit Inc. vs Fiserv, Inc.
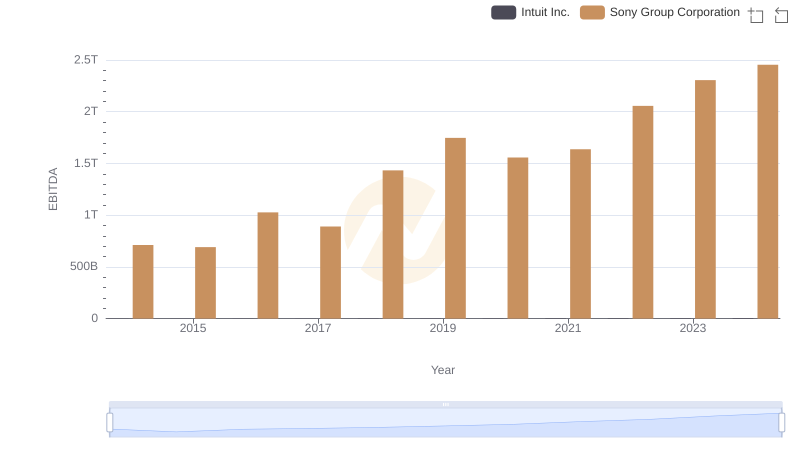
EBITDA Performance Review: Intuit Inc. vs Sony Group Corporation