| __timestamp | Intuit Inc. | Sony Group Corporation |
|---|---|---|
| Wednesday, January 1, 2014 | 4506000000 | 7767266000000 |
| Thursday, January 1, 2015 | 4192000000 | 8215880000000 |
| Friday, January 1, 2016 | 4694000000 | 8105712000000 |
| Sunday, January 1, 2017 | 5177000000 | 7603250000000 |
| Monday, January 1, 2018 | 5964000000 | 8543982000000 |
| Tuesday, January 1, 2019 | 6784000000 | 8665687000000 |
| Wednesday, January 1, 2020 | 7679000000 | 8259885000000 |
| Friday, January 1, 2021 | 9633000000 | 8999360000000 |
| Saturday, January 1, 2022 | 12726000000 | 9921513000000 |
| Sunday, January 1, 2023 | 14368000000 | 11539837000000 |
| Monday, January 1, 2024 | 16285000000 | 13020768000000 |
Data in motion
In the ever-evolving landscape of global business, Intuit Inc. and Sony Group Corporation stand as titans in their respective fields. Over the past decade, Intuit, a leader in financial software, has seen its revenue grow by an impressive 261%, from $4.5 billion in 2014 to $16.3 billion in 2024. This growth underscores the increasing demand for digital financial solutions.
Meanwhile, Sony, a powerhouse in electronics and entertainment, has maintained a robust revenue stream, with a 67% increase from $7.8 trillion in 2014 to $13 trillion in 2024. This steady rise highlights Sony's resilience and adaptability in a competitive market.
While Intuit's growth rate is remarkable, Sony's sheer scale of revenue is a testament to its global reach and diversified portfolio. This comparison offers a fascinating glimpse into how two industry leaders navigate their unique challenges and opportunities.
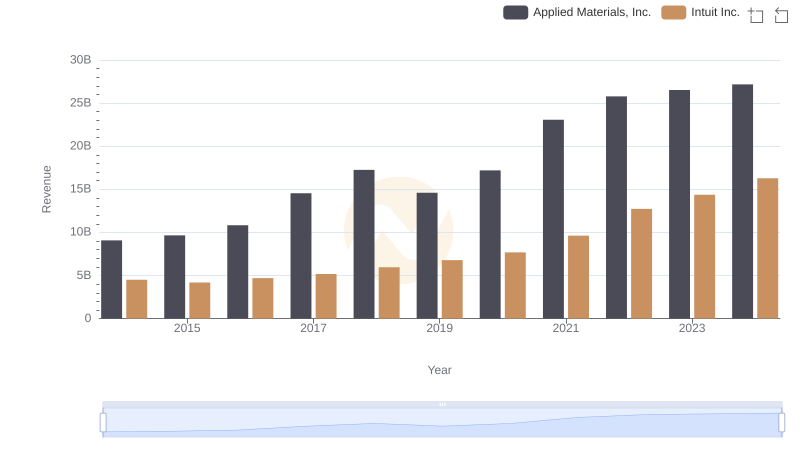
Revenue Insights: Intuit Inc. and Applied Materials, Inc. Performance Compared
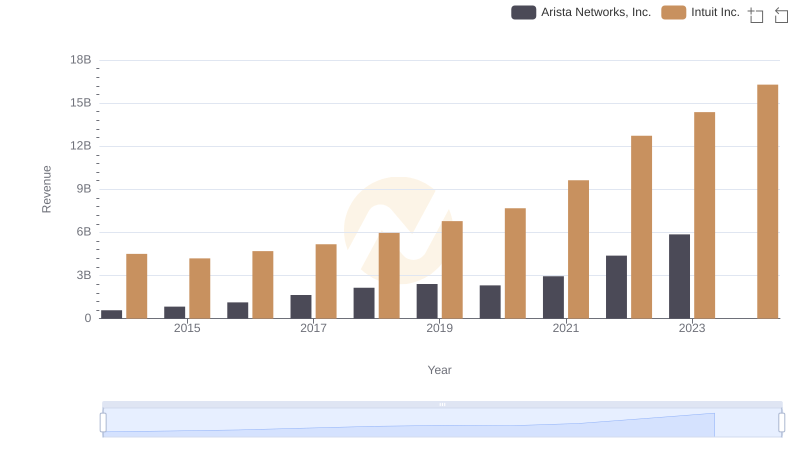
Annual Revenue Comparison: Intuit Inc. vs Arista Networks, Inc.
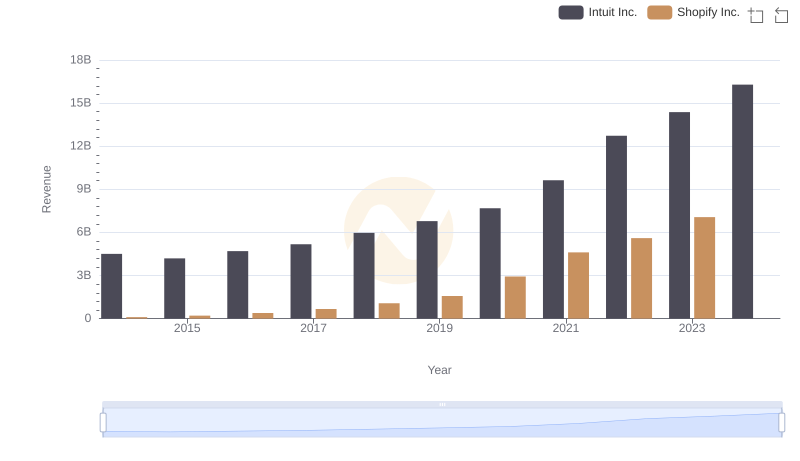
Breaking Down Revenue Trends: Intuit Inc. vs Shopify Inc.
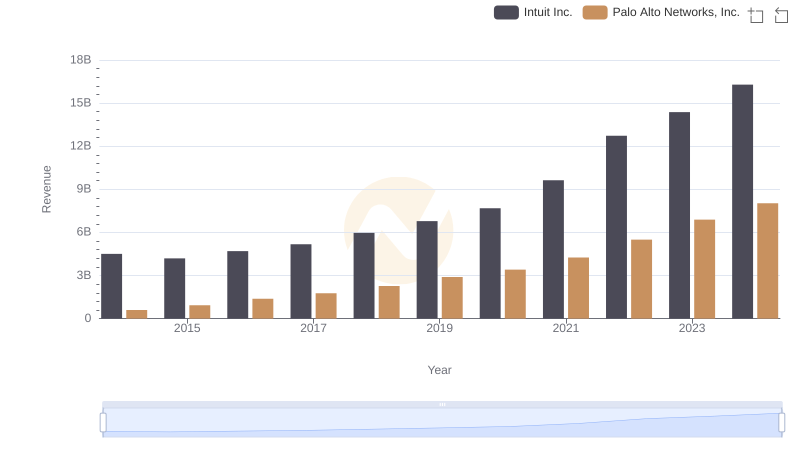
Breaking Down Revenue Trends: Intuit Inc. vs Palo Alto Networks, Inc.
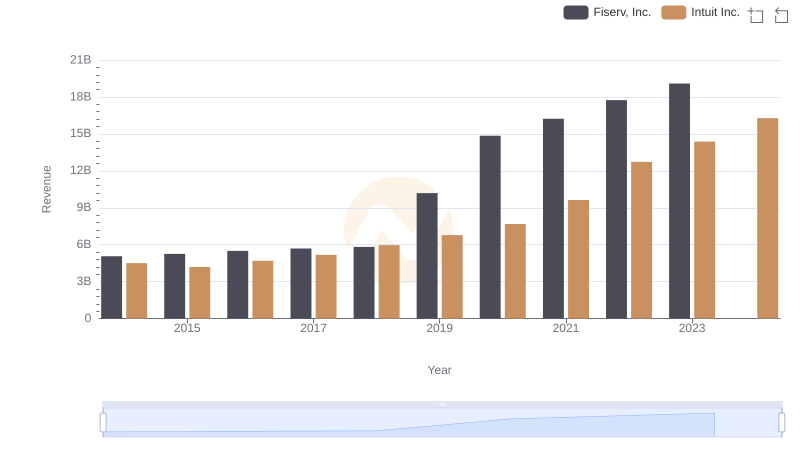
Comparing Revenue Performance: Intuit Inc. or Fiserv, Inc.?
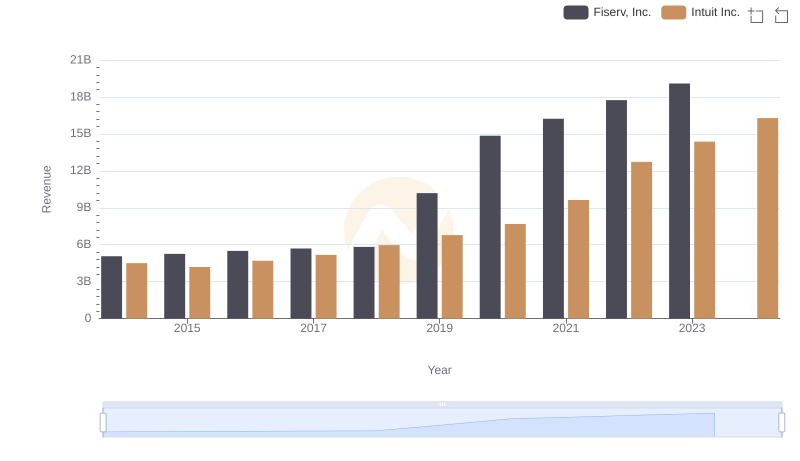
Annual Revenue Comparison: Intuit Inc. vs Fiserv, Inc.
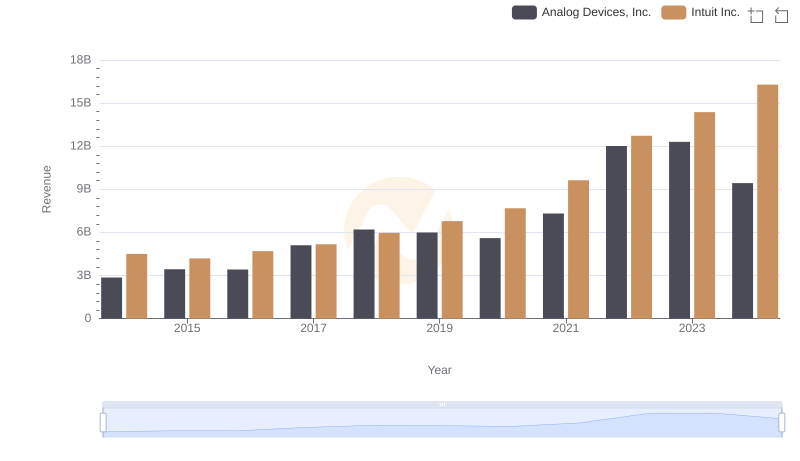
Who Generates More Revenue? Intuit Inc. or Analog Devices, Inc.
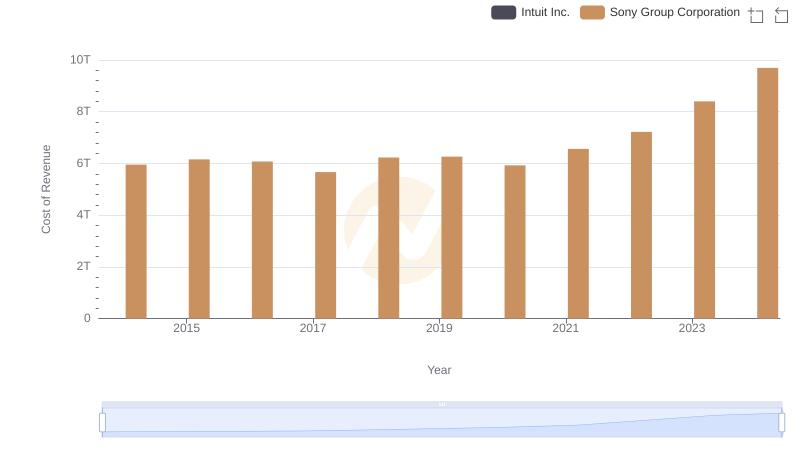
Cost of Revenue Trends: Intuit Inc. vs Sony Group Corporation
Breaking Down Revenue Trends: Intuit Inc. vs Micron Technology, Inc.
Gross Profit Analysis: Comparing Intuit Inc. and Sony Group Corporation
Who Optimizes SG&A Costs Better? Intuit Inc. or Sony Group Corporation
EBITDA Performance Review: Intuit Inc. vs Sony Group Corporation