| __timestamp | Analog Devices, Inc. | Intuit Inc. |
|---|---|---|
| Wednesday, January 1, 2014 | 943421000 | 1528000000 |
| Thursday, January 1, 2015 | 1059384000 | 970000000 |
| Friday, January 1, 2016 | 1255468000 | 1480000000 |
| Sunday, January 1, 2017 | 1665464000 | 1634000000 |
| Monday, January 1, 2018 | 2706642000 | 1839000000 |
| Tuesday, January 1, 2019 | 2527491000 | 2121000000 |
| Wednesday, January 1, 2020 | 2317701000 | 2430000000 |
| Friday, January 1, 2021 | 2600723000 | 2948000000 |
| Saturday, January 1, 2022 | 5611579000 | 3369000000 |
| Sunday, January 1, 2023 | 6150827000 | 4043000000 |
| Monday, January 1, 2024 | 2032798000 | 4581000000 |
Data in motion
In the ever-evolving landscape of technology and finance, two giants, Intuit Inc. and Analog Devices, Inc., have been vying for dominance. Over the past decade, their EBITDA performances have painted a fascinating picture of resilience and growth.
From 2014 to 2023, Analog Devices, Inc. saw a staggering 550% increase in EBITDA, peaking in 2023. Meanwhile, Intuit Inc. demonstrated a robust upward trajectory, with a 165% rise over the same period, culminating in 2023. Notably, 2022 marked a pivotal year for both companies, with Analog Devices, Inc. experiencing a 115% surge, while Intuit Inc. achieved a 15% increase.
As we look to the future, 2024 presents a curious anomaly with a dip in Analog Devices, Inc.'s EBITDA, contrasting with Intuit Inc.'s continued ascent. This dynamic interplay underscores the unpredictable nature of the tech industry, where innovation and strategy dictate success.
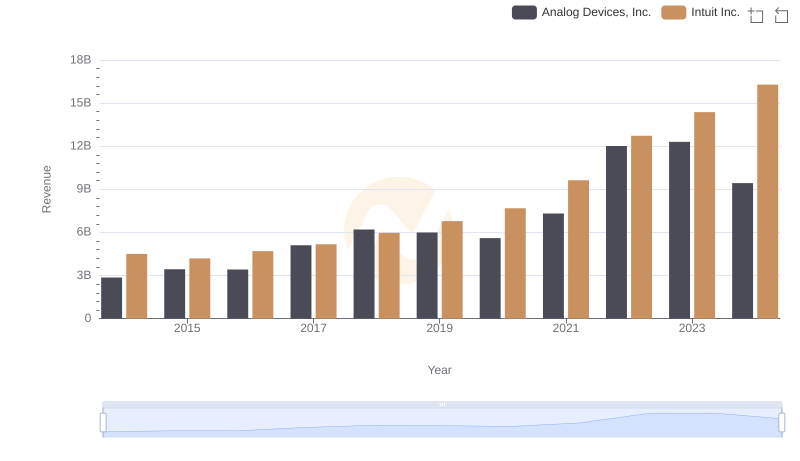
Who Generates More Revenue? Intuit Inc. or Analog Devices, Inc.
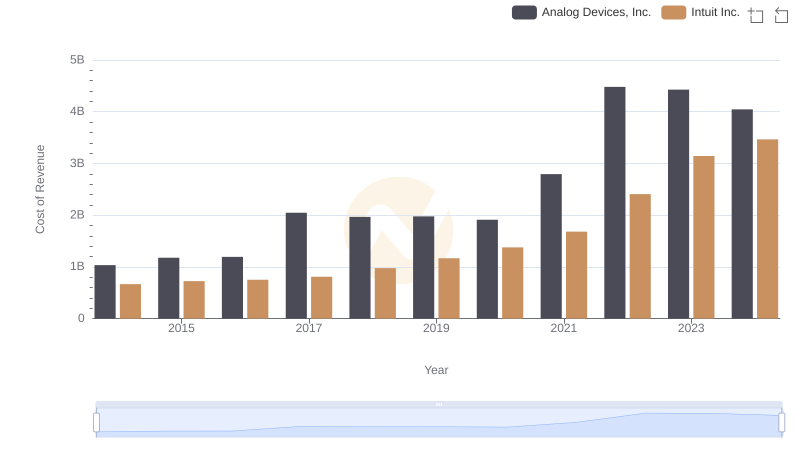
Cost Insights: Breaking Down Intuit Inc. and Analog Devices, Inc.'s Expenses
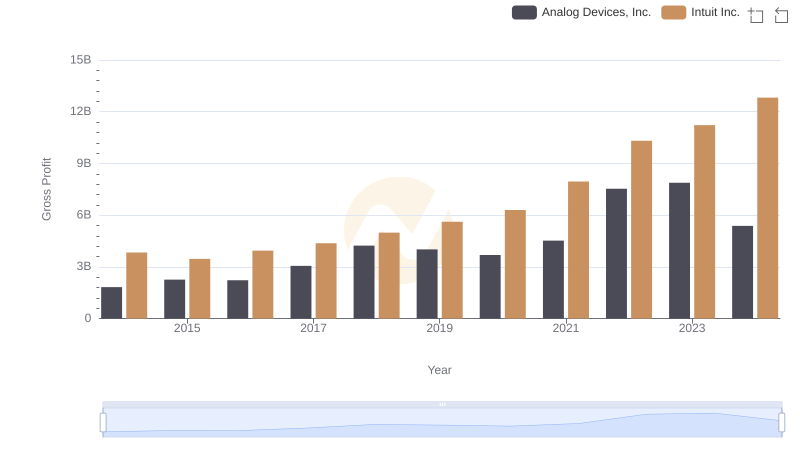
Who Generates Higher Gross Profit? Intuit Inc. or Analog Devices, Inc.
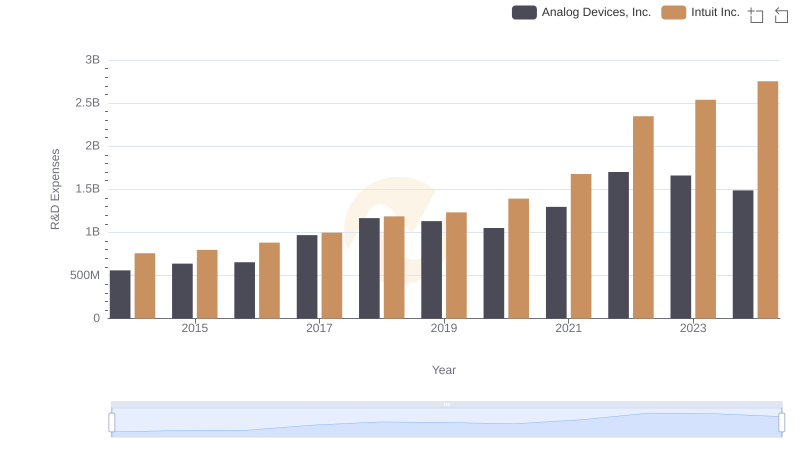
Research and Development Investment: Intuit Inc. vs Analog Devices, Inc.
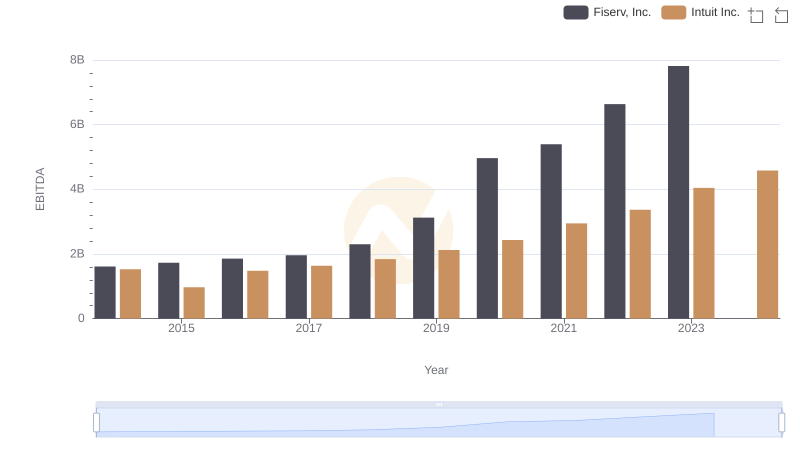
Comprehensive EBITDA Comparison: Intuit Inc. vs Fiserv, Inc.
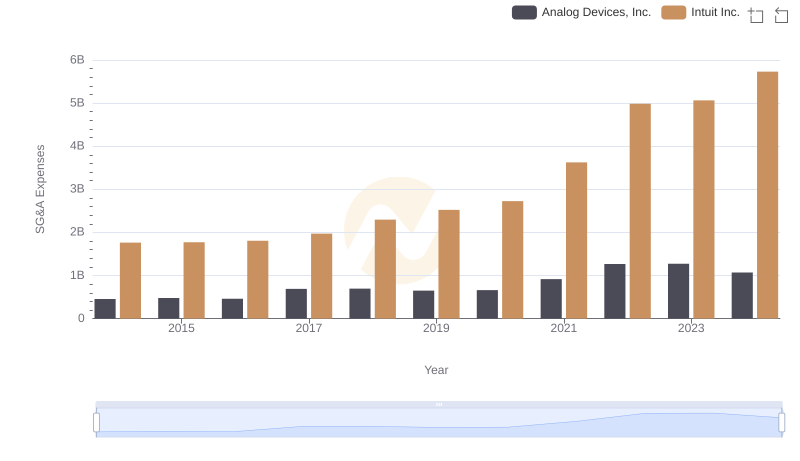
Who Optimizes SG&A Costs Better? Intuit Inc. or Analog Devices, Inc.
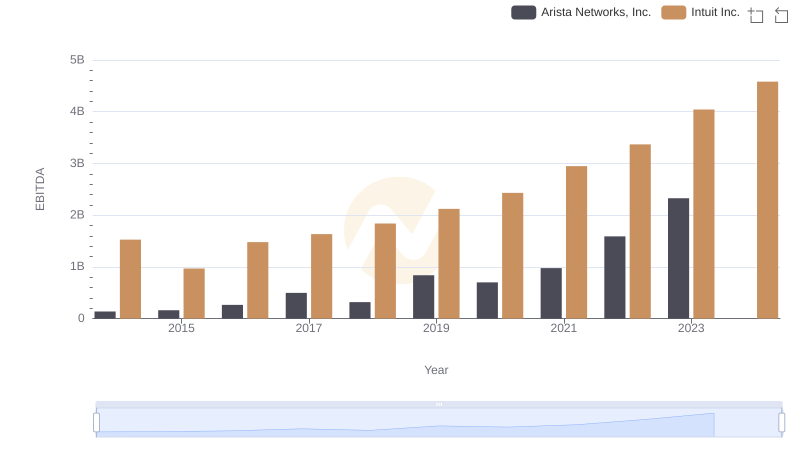
Intuit Inc. and Arista Networks, Inc.: A Detailed Examination of EBITDA Performance

Comprehensive EBITDA Comparison: Intuit Inc. vs Fiserv, Inc.
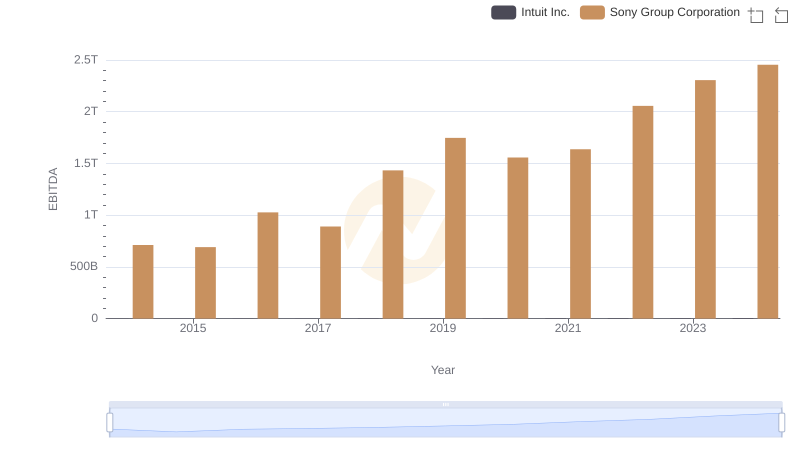
EBITDA Performance Review: Intuit Inc. vs Sony Group Corporation
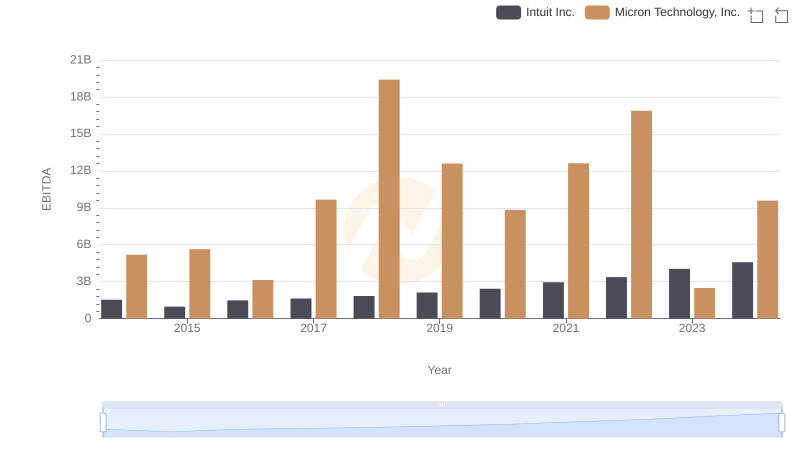
A Side-by-Side Analysis of EBITDA: Intuit Inc. and Micron Technology, Inc.
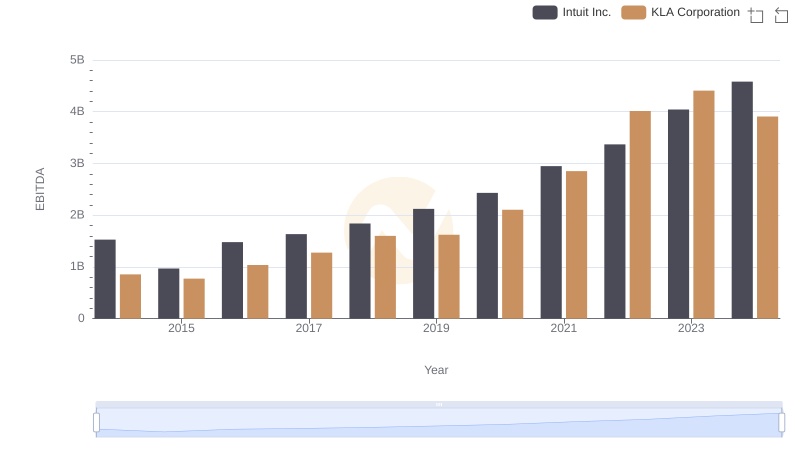
Intuit Inc. vs KLA Corporation: In-Depth EBITDA Performance Comparison
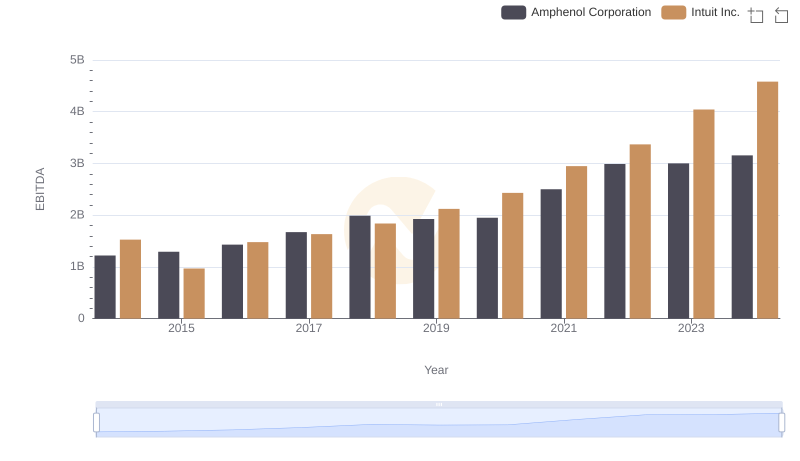
A Side-by-Side Analysis of EBITDA: Intuit Inc. and Amphenol Corporation