| __timestamp | Intuit Inc. | NetEase, Inc. |
|---|---|---|
| Wednesday, January 1, 2014 | 1528000000 | 4939587000 |
| Thursday, January 1, 2015 | 970000000 | 7454573000 |
| Friday, January 1, 2016 | 1480000000 | 12956379000 |
| Sunday, January 1, 2017 | 1634000000 | 13786691000 |
| Monday, January 1, 2018 | 1839000000 | 12037479000 |
| Tuesday, January 1, 2019 | 2121000000 | 16404433000 |
| Wednesday, January 1, 2020 | 2430000000 | 17996187000 |
| Friday, January 1, 2021 | 2948000000 | 19692797000 |
| Saturday, January 1, 2022 | 3369000000 | 22486802000 |
| Sunday, January 1, 2023 | 4043000000 | 30764404000 |
| Monday, January 1, 2024 | 4581000000 |
In pursuit of knowledge
In the ever-evolving landscape of global business, the financial performance of companies is a testament to their strategic prowess and market adaptability. Over the past decade, Intuit Inc. and NetEase, Inc. have showcased remarkable EBITDA growth, reflecting their resilience and innovation.
From 2014 to 2023, Intuit Inc. has seen its EBITDA grow by approximately 200%, starting from a modest 1.5 billion to an impressive 4 billion. This growth underscores Intuit's strategic focus on expanding its product offerings and enhancing customer experience.
Meanwhile, NetEase, Inc. has demonstrated an even more staggering growth trajectory, with its EBITDA surging by over 500% from 4.9 billion to a peak of 30.8 billion in 2023. This growth highlights NetEase's successful ventures into new markets and its ability to capitalize on the digital economy.
While 2024 data for NetEase remains elusive, the trends from the past decade paint a vivid picture of two companies that have not only survived but thrived in a competitive global market.
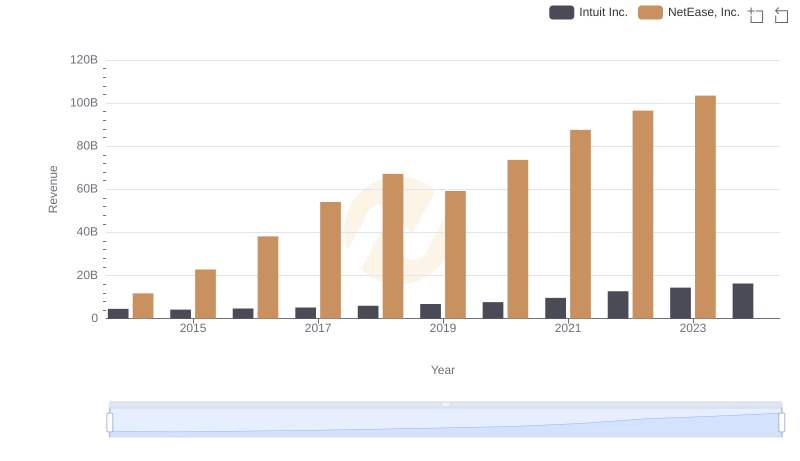
Breaking Down Revenue Trends: Intuit Inc. vs NetEase, Inc.
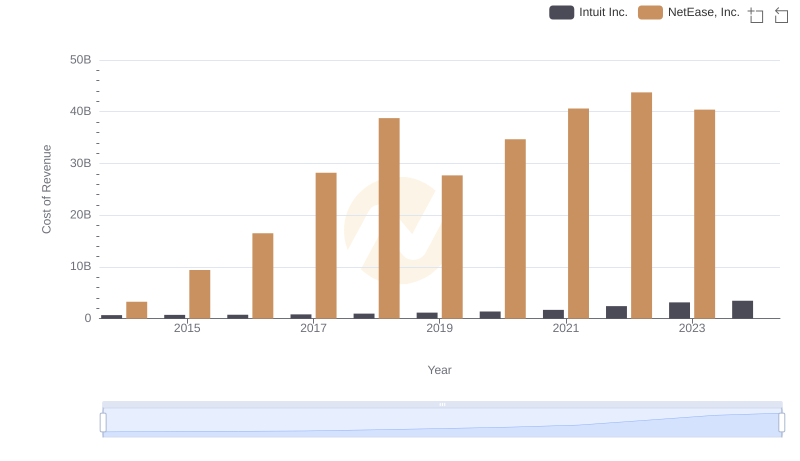
Cost of Revenue: Key Insights for Intuit Inc. and NetEase, Inc.
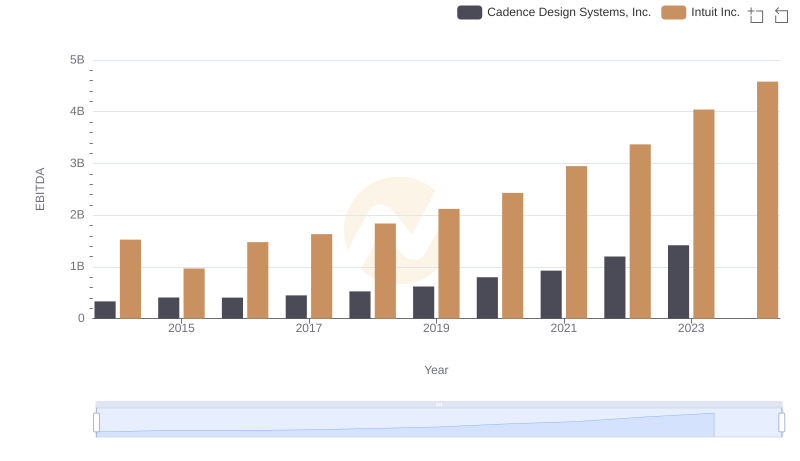
Comparative EBITDA Analysis: Intuit Inc. vs Cadence Design Systems, Inc.
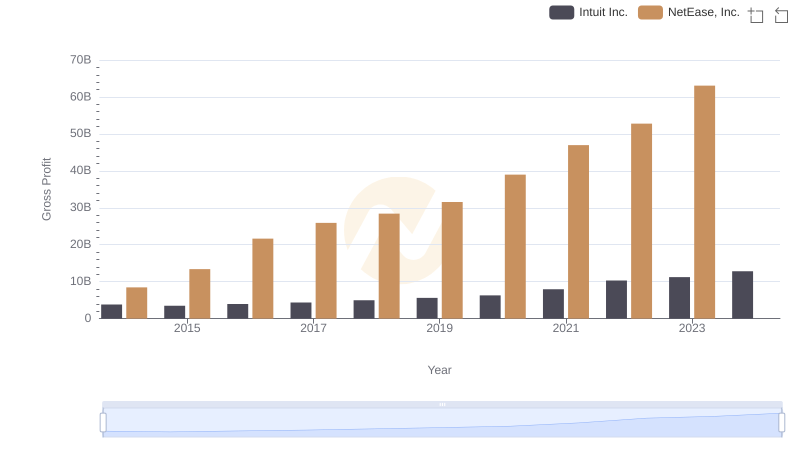
Who Generates Higher Gross Profit? Intuit Inc. or NetEase, Inc.
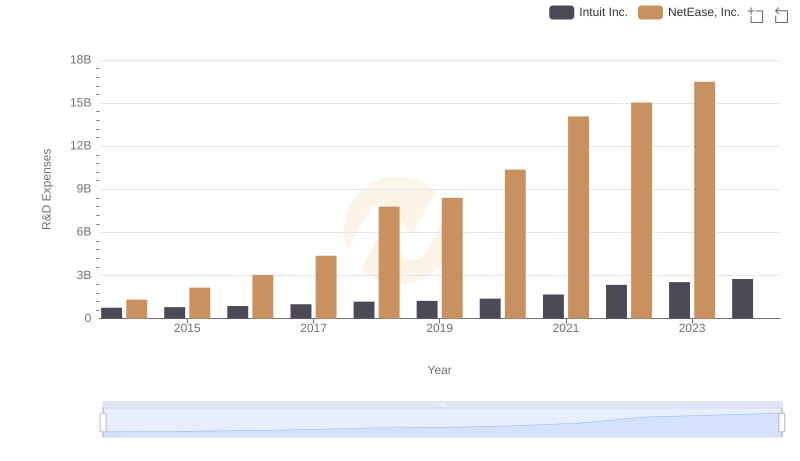
Research and Development Investment: Intuit Inc. vs NetEase, Inc.
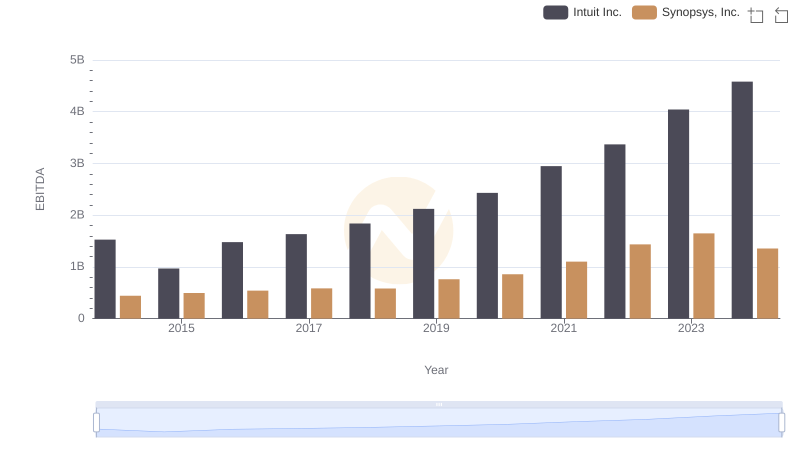
EBITDA Analysis: Evaluating Intuit Inc. Against Synopsys, Inc.
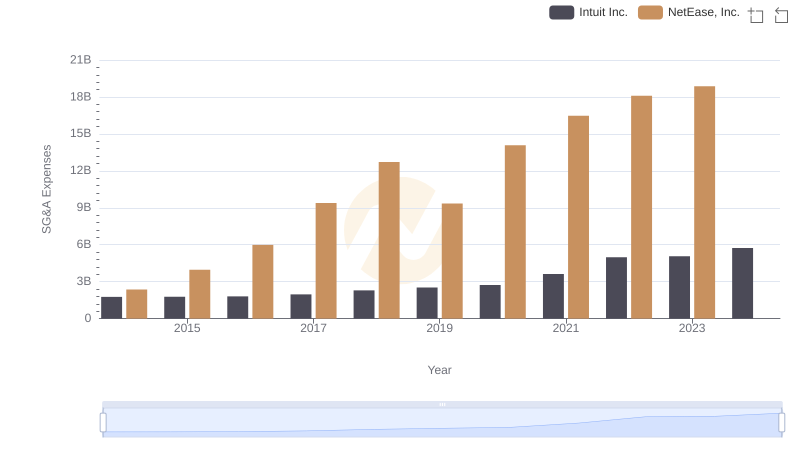
Breaking Down SG&A Expenses: Intuit Inc. vs NetEase, Inc.
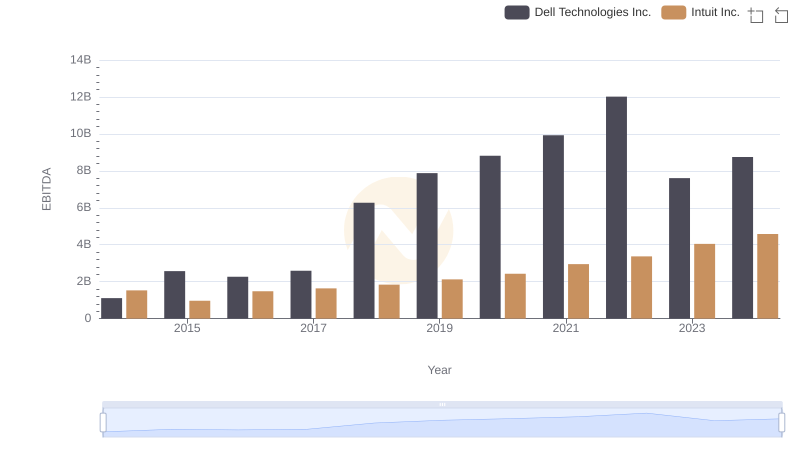
Intuit Inc. vs Dell Technologies Inc.: In-Depth EBITDA Performance Comparison
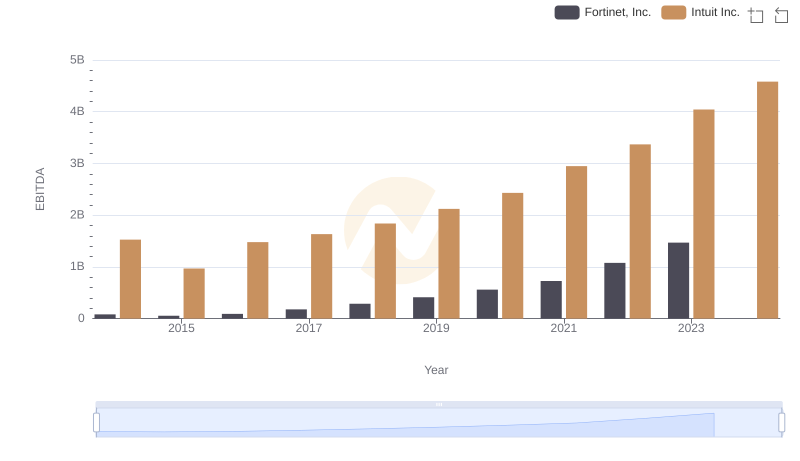
A Professional Review of EBITDA: Intuit Inc. Compared to Fortinet, Inc.
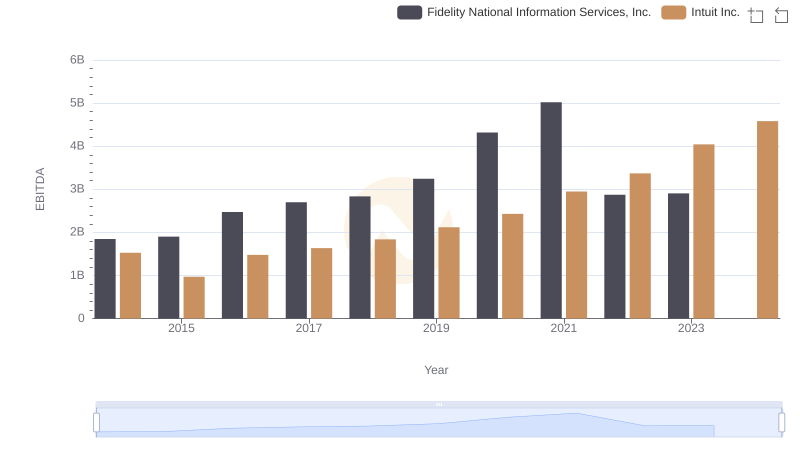
Comparative EBITDA Analysis: Intuit Inc. vs Fidelity National Information Services, Inc.
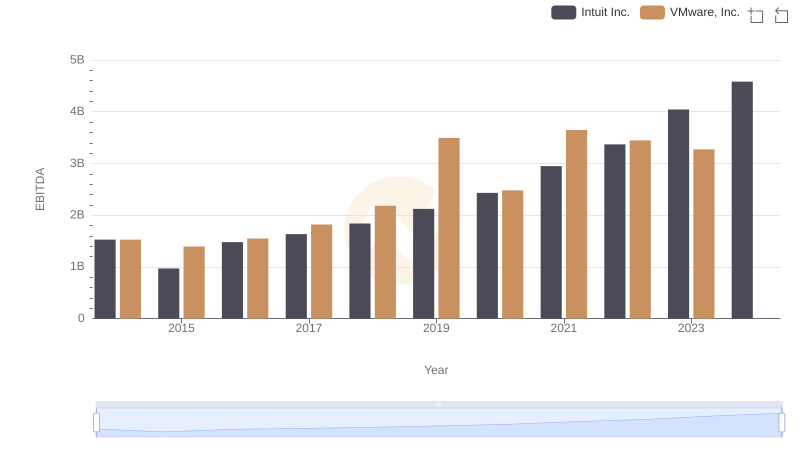
EBITDA Analysis: Evaluating Intuit Inc. Against VMware, Inc.
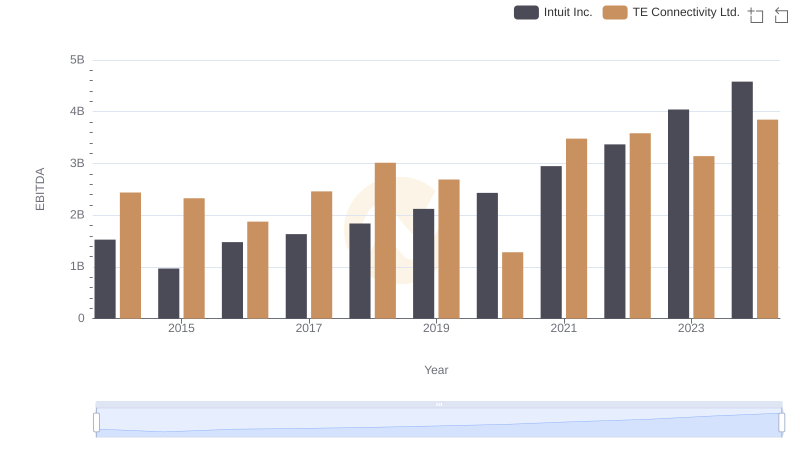
Intuit Inc. vs TE Connectivity Ltd.: In-Depth EBITDA Performance Comparison