| __timestamp | Cadence Design Systems, Inc. | Intuit Inc. |
|---|---|---|
| Wednesday, January 1, 2014 | 332530000 | 1528000000 |
| Thursday, January 1, 2015 | 408806000 | 970000000 |
| Friday, January 1, 2016 | 406544000 | 1480000000 |
| Sunday, January 1, 2017 | 448885000 | 1634000000 |
| Monday, January 1, 2018 | 526019000 | 1839000000 |
| Tuesday, January 1, 2019 | 620586000 | 2121000000 |
| Wednesday, January 1, 2020 | 799150000 | 2430000000 |
| Friday, January 1, 2021 | 927723000 | 2948000000 |
| Saturday, January 1, 2022 | 1200385000 | 3369000000 |
| Sunday, January 1, 2023 | 1419630000 | 4043000000 |
| Monday, January 1, 2024 | 1350763000 | 4581000000 |
Igniting the spark of knowledge
In the ever-evolving landscape of financial technology and electronic design automation, Intuit Inc. and Cadence Design Systems, Inc. have emerged as industry leaders. Over the past decade, from 2014 to 2023, both companies have demonstrated impressive growth in their EBITDA, a key indicator of financial health and operational efficiency.
Intuit Inc. has consistently outperformed, with its EBITDA growing by approximately 165% from 2014 to 2023. This growth reflects Intuit's strategic focus on expanding its product offerings and enhancing customer experience. Meanwhile, Cadence Design Systems, Inc. has also shown remarkable progress, with its EBITDA increasing by over 325% during the same period, underscoring its innovation in electronic design solutions.
While 2024 data for Cadence is not yet available, Intuit's continued upward trajectory suggests a promising future. This comparative analysis highlights the dynamic nature of these industries and the companies driving their evolution.
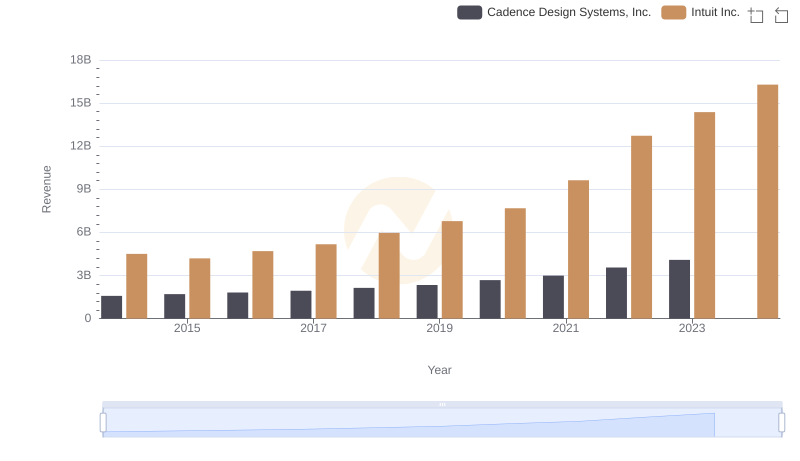
Who Generates More Revenue? Intuit Inc. or Cadence Design Systems, Inc.
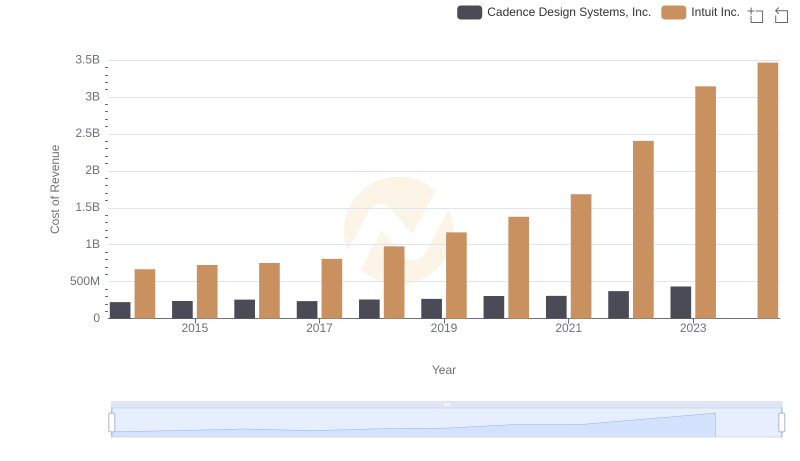
Cost of Revenue Trends: Intuit Inc. vs Cadence Design Systems, Inc.
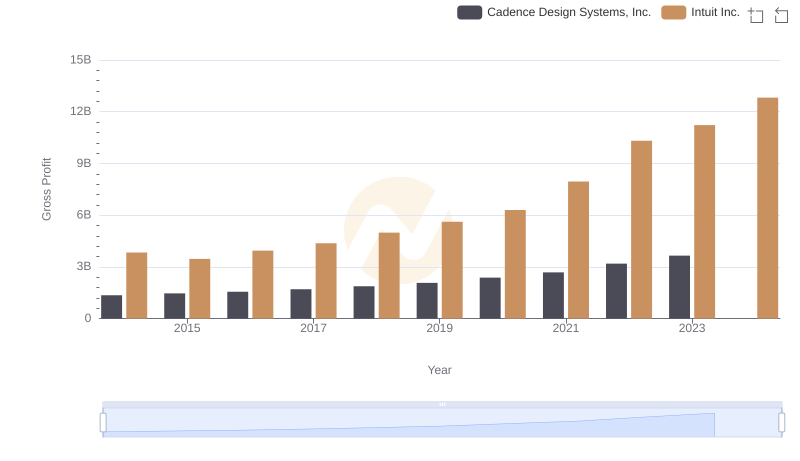
Key Insights on Gross Profit: Intuit Inc. vs Cadence Design Systems, Inc.
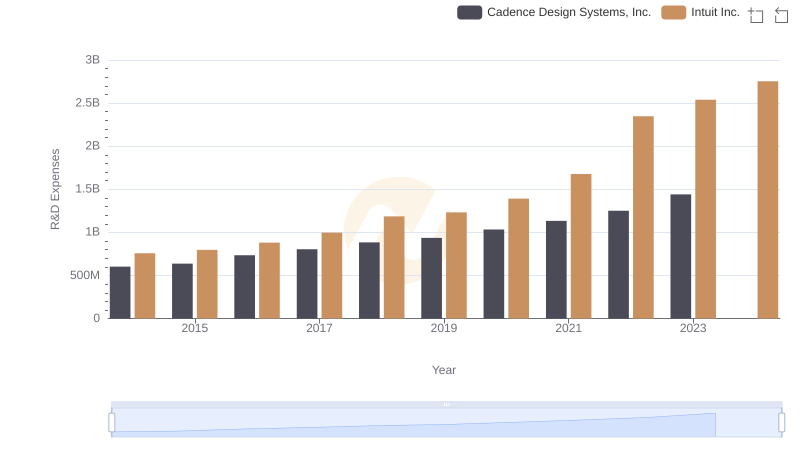
Comparing Innovation Spending: Intuit Inc. and Cadence Design Systems, Inc.
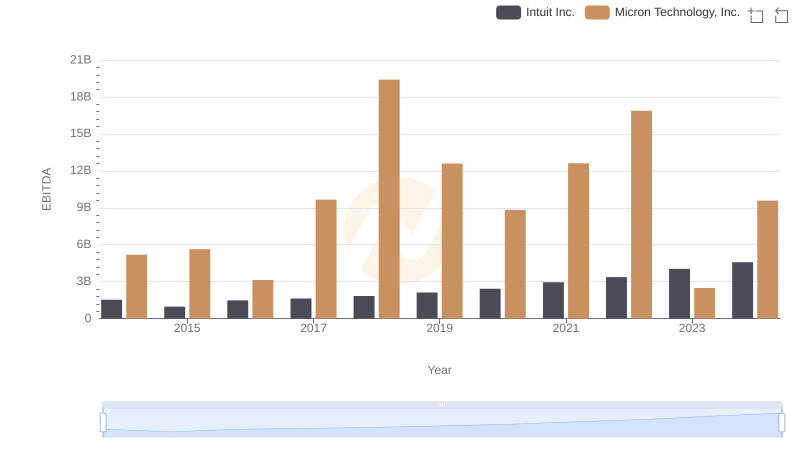
A Side-by-Side Analysis of EBITDA: Intuit Inc. and Micron Technology, Inc.
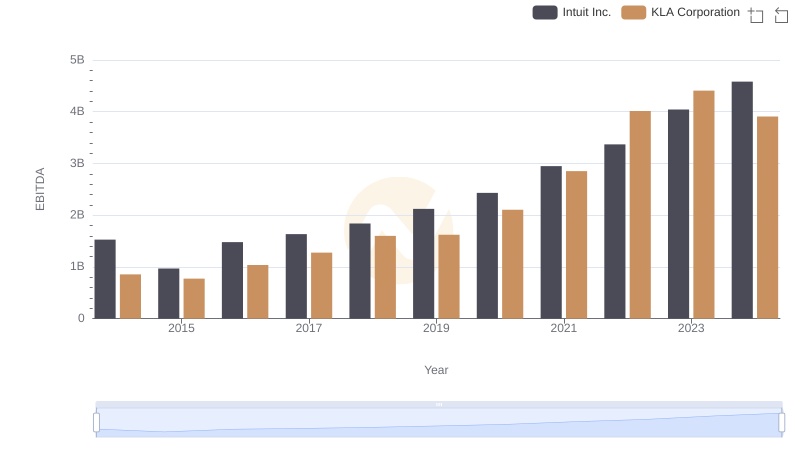
Intuit Inc. vs KLA Corporation: In-Depth EBITDA Performance Comparison
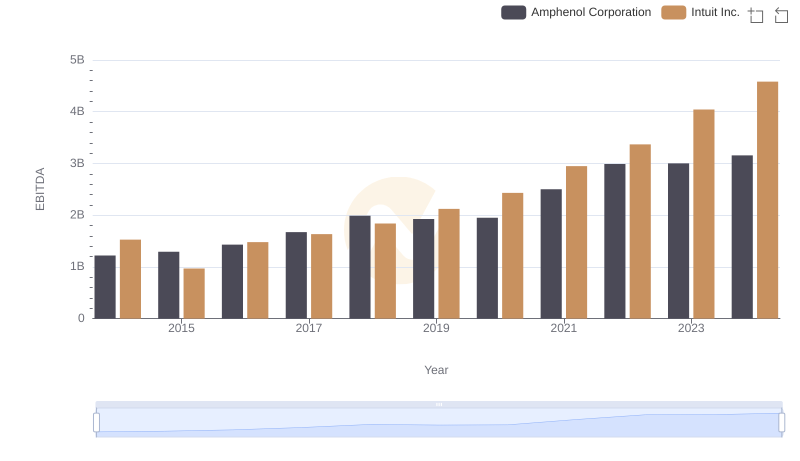
A Side-by-Side Analysis of EBITDA: Intuit Inc. and Amphenol Corporation
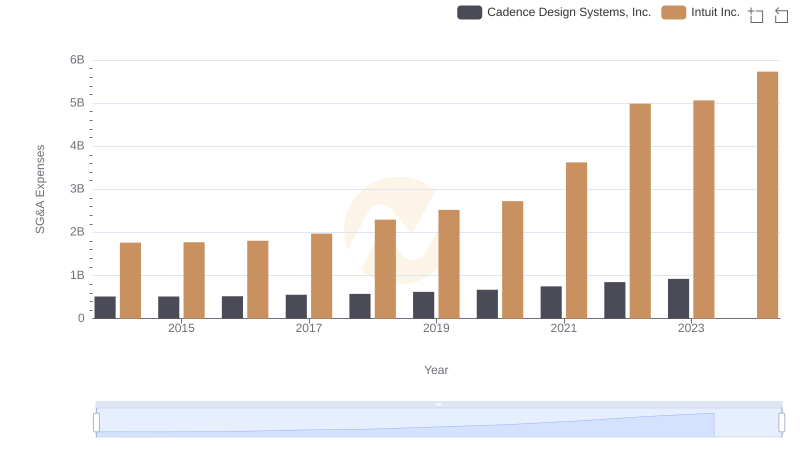
Operational Costs Compared: SG&A Analysis of Intuit Inc. and Cadence Design Systems, Inc.
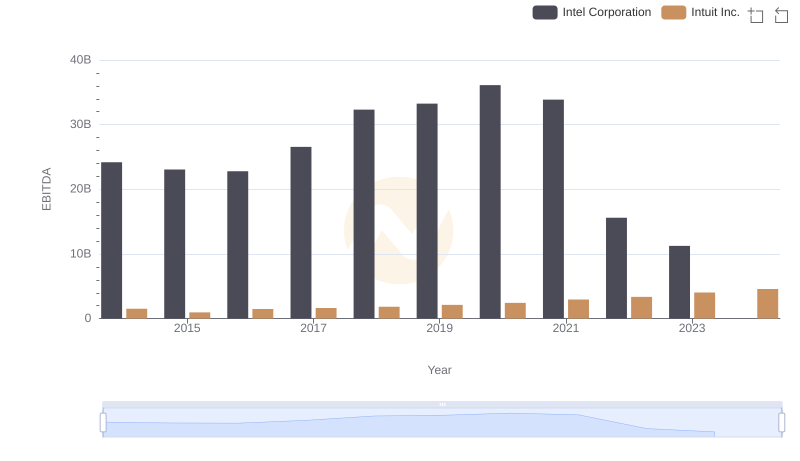
A Professional Review of EBITDA: Intuit Inc. Compared to Intel Corporation
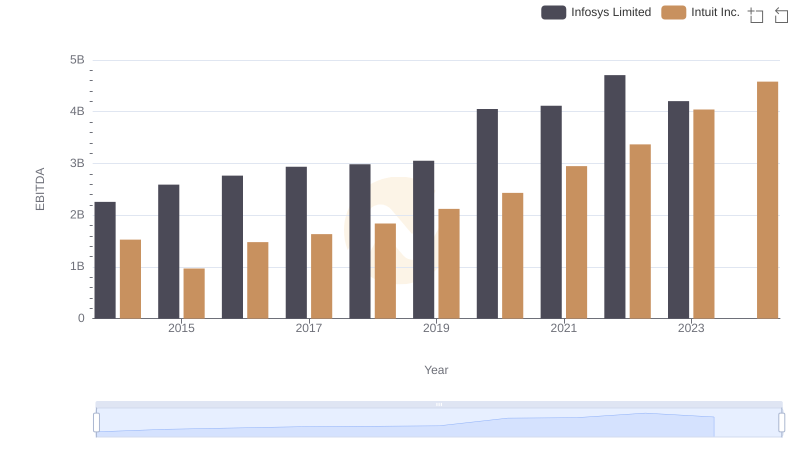
Intuit Inc. and Infosys Limited: A Detailed Examination of EBITDA Performance
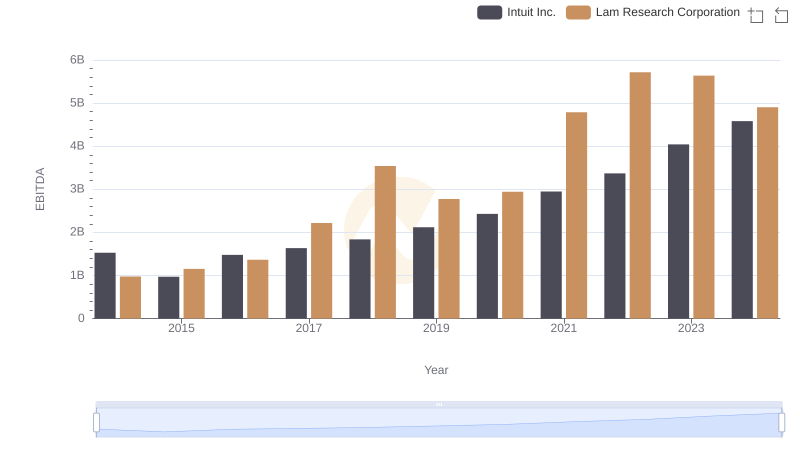
Intuit Inc. and Lam Research Corporation: A Detailed Examination of EBITDA Performance
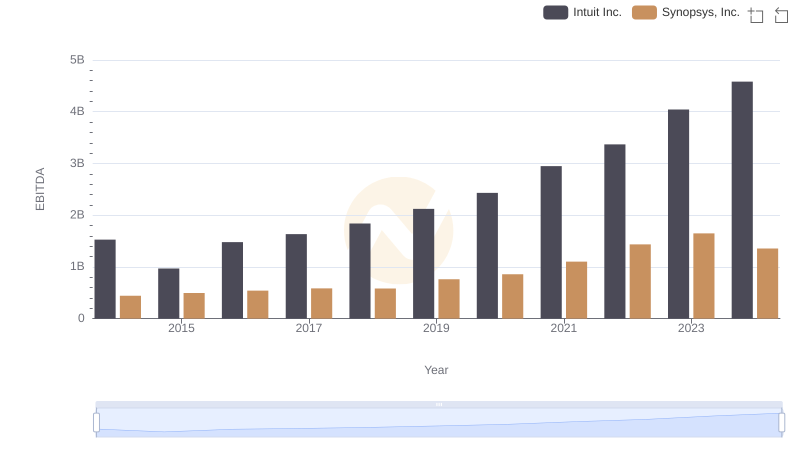
EBITDA Analysis: Evaluating Intuit Inc. Against Synopsys, Inc.