| __timestamp | Intuit Inc. | NetEase, Inc. |
|---|---|---|
| Wednesday, January 1, 2014 | 1762000000 | 2362667000 |
| Thursday, January 1, 2015 | 1771000000 | 3972624000 |
| Friday, January 1, 2016 | 1807000000 | 5987969000 |
| Sunday, January 1, 2017 | 1973000000 | 9387454000 |
| Monday, January 1, 2018 | 2298000000 | 12718007000 |
| Tuesday, January 1, 2019 | 2524000000 | 9351425000 |
| Wednesday, January 1, 2020 | 2727000000 | 14075615000 |
| Friday, January 1, 2021 | 3626000000 | 16477740000 |
| Saturday, January 1, 2022 | 4986000000 | 18098519000 |
| Sunday, January 1, 2023 | 5062000000 | 18869340000 |
| Monday, January 1, 2024 | 5730000000 |
Data in motion
In the ever-evolving landscape of global business, understanding the financial strategies of industry leaders is crucial. This analysis delves into the Selling, General, and Administrative (SG&A) expenses of two titans: Intuit Inc. and NetEase, Inc., from 2014 to 2023.
Intuit Inc., a leader in financial software, has seen its SG&A expenses grow by over 225% during this period, reflecting its aggressive expansion and innovation strategies. In contrast, NetEase, Inc., a major player in the Chinese internet technology sector, has experienced a staggering 700% increase in SG&A expenses, highlighting its rapid growth and market penetration efforts.
While Intuit's expenses peaked at $5.73 billion in 2024, NetEase's expenses reached an impressive $18.87 billion in 2023, showcasing its dominance in the Asian market. This comparison underscores the diverse strategies employed by these companies to maintain their competitive edge.
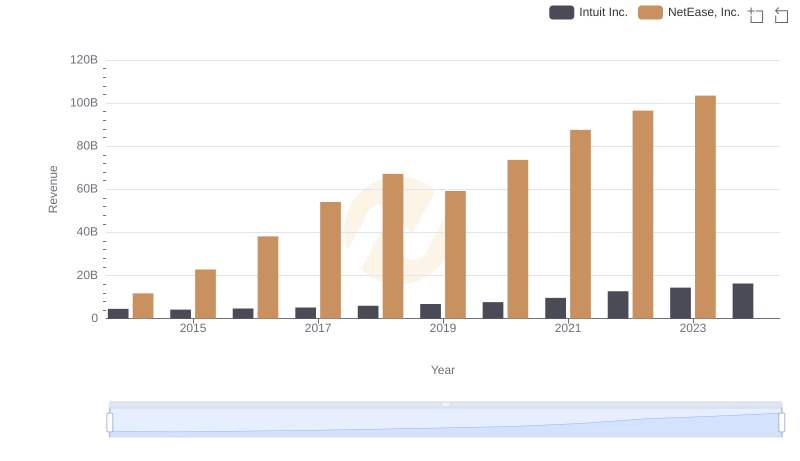
Breaking Down Revenue Trends: Intuit Inc. vs NetEase, Inc.
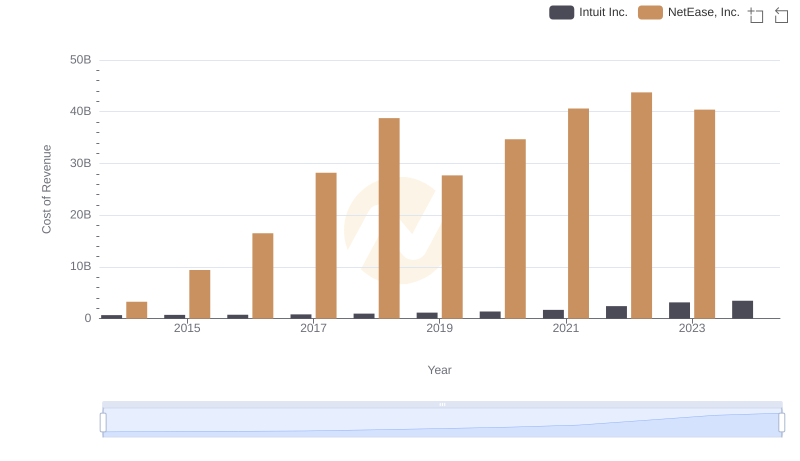
Cost of Revenue: Key Insights for Intuit Inc. and NetEase, Inc.
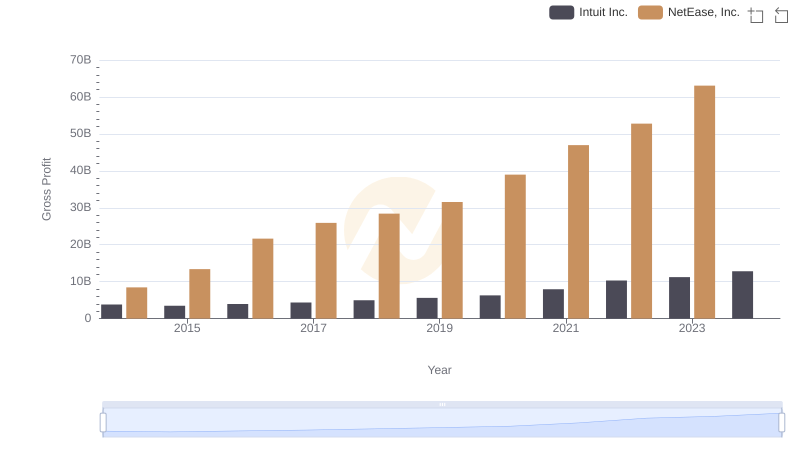
Who Generates Higher Gross Profit? Intuit Inc. or NetEase, Inc.
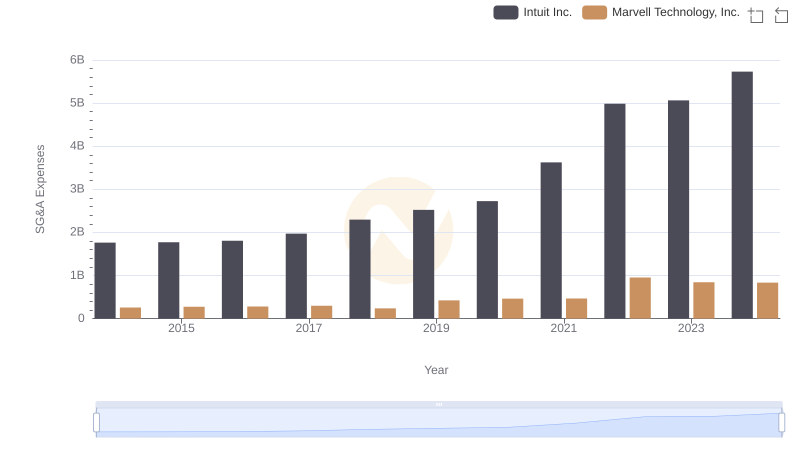
Operational Costs Compared: SG&A Analysis of Intuit Inc. and Marvell Technology, Inc.
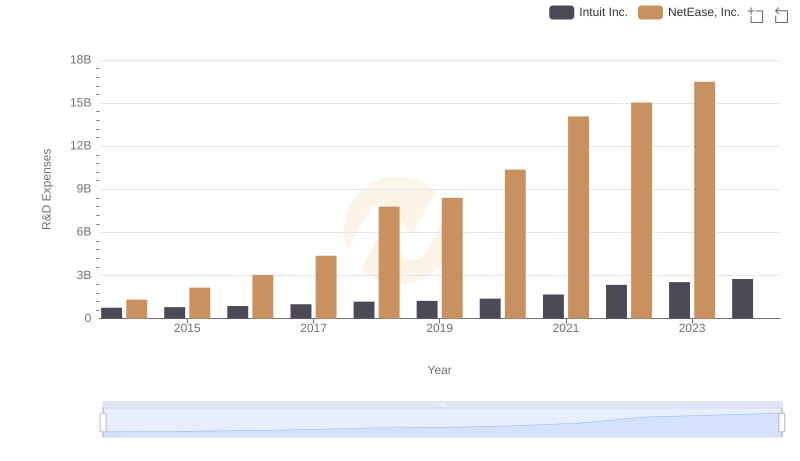
Research and Development Investment: Intuit Inc. vs NetEase, Inc.
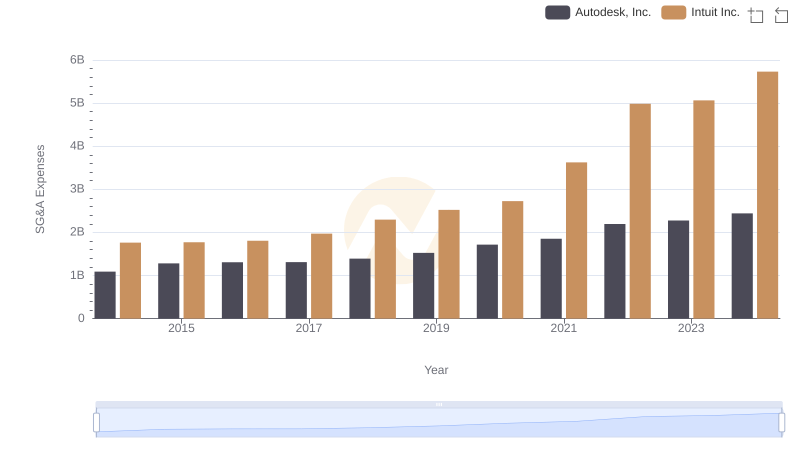
Intuit Inc. vs Autodesk, Inc.: SG&A Expense Trends
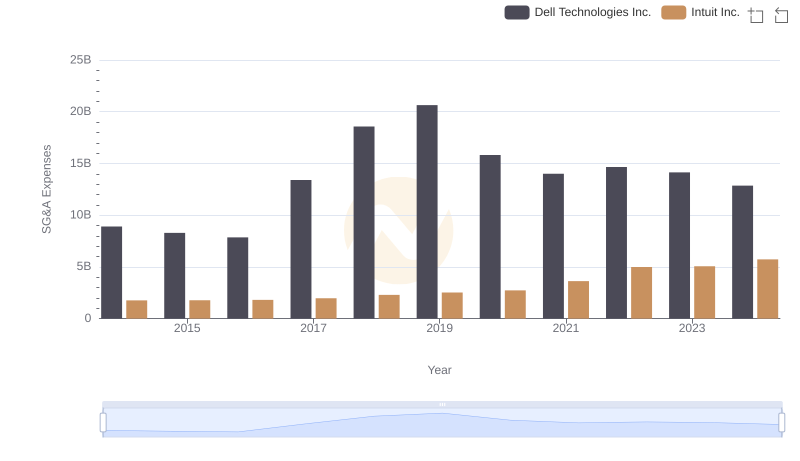
Operational Costs Compared: SG&A Analysis of Intuit Inc. and Dell Technologies Inc.
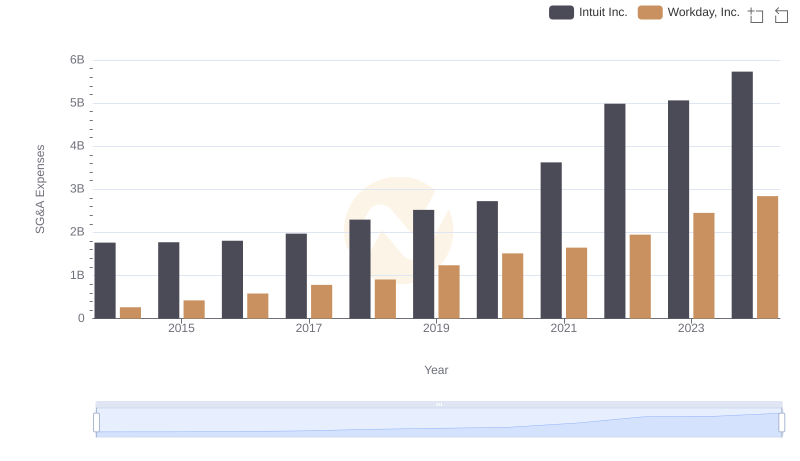
Intuit Inc. and Workday, Inc.: SG&A Spending Patterns Compared
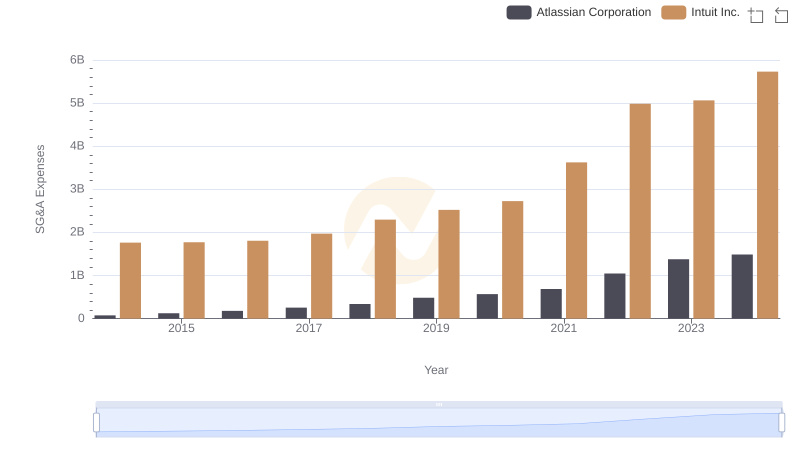
Who Optimizes SG&A Costs Better? Intuit Inc. or Atlassian Corporation
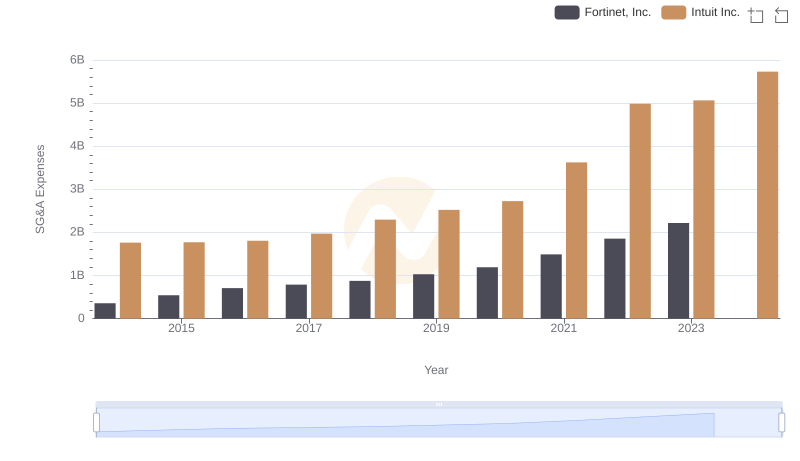
SG&A Efficiency Analysis: Comparing Intuit Inc. and Fortinet, Inc.
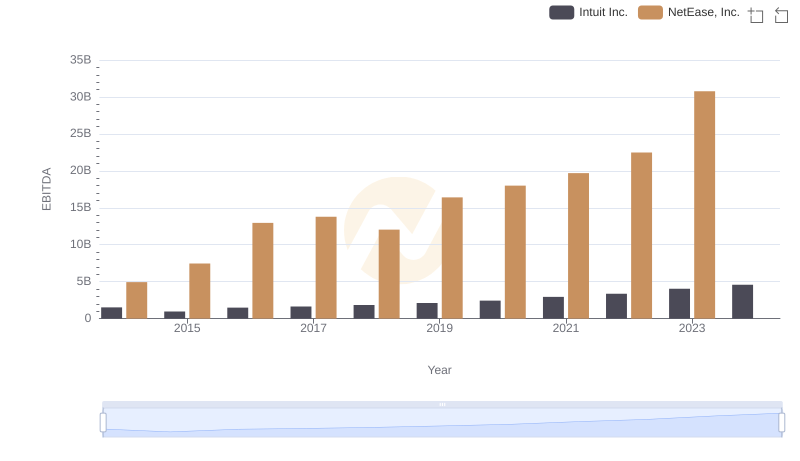
EBITDA Performance Review: Intuit Inc. vs NetEase, Inc.
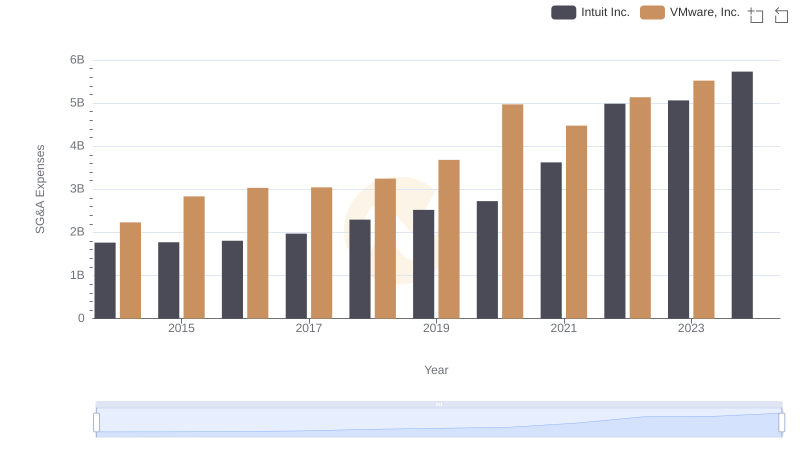
Cost Management Insights: SG&A Expenses for Intuit Inc. and VMware, Inc.