| __timestamp | Fidelity National Information Services, Inc. | Intuit Inc. |
|---|---|---|
| Wednesday, January 1, 2014 | 1846200000 | 1528000000 |
| Thursday, January 1, 2015 | 1901000000 | 970000000 |
| Friday, January 1, 2016 | 2474000000 | 1480000000 |
| Sunday, January 1, 2017 | 2700000000 | 1634000000 |
| Monday, January 1, 2018 | 2837000000 | 1839000000 |
| Tuesday, January 1, 2019 | 3244000000 | 2121000000 |
| Wednesday, January 1, 2020 | 4319000000 | 2430000000 |
| Friday, January 1, 2021 | 5021000000 | 2948000000 |
| Saturday, January 1, 2022 | 2875000000 | 3369000000 |
| Sunday, January 1, 2023 | 2906000000 | 4043000000 |
| Monday, January 1, 2024 | 1709000000 | 4581000000 |
Data in motion
In the ever-evolving landscape of financial technology, Intuit Inc. and Fidelity National Information Services, Inc. (FIS) have emerged as titans. Over the past decade, these companies have showcased remarkable growth in their EBITDA, a key indicator of financial health. From 2014 to 2023, Intuit's EBITDA surged by approximately 165%, peaking in 2023 with a notable 4.04 billion. In contrast, FIS experienced a more volatile journey, with a peak in 2021, followed by a dip in subsequent years. Notably, Intuit's consistent upward trajectory contrasts with FIS's fluctuating performance, highlighting Intuit's strategic resilience. As we look to 2024, Intuit's data remains robust, while FIS's figures are conspicuously absent, leaving room for speculation. This comparative analysis underscores the dynamic nature of the fintech sector and the strategic maneuvers that define industry leaders.
"Intuit's Steady Climb vs. FIS's Volatile Path: A Decade in Review"
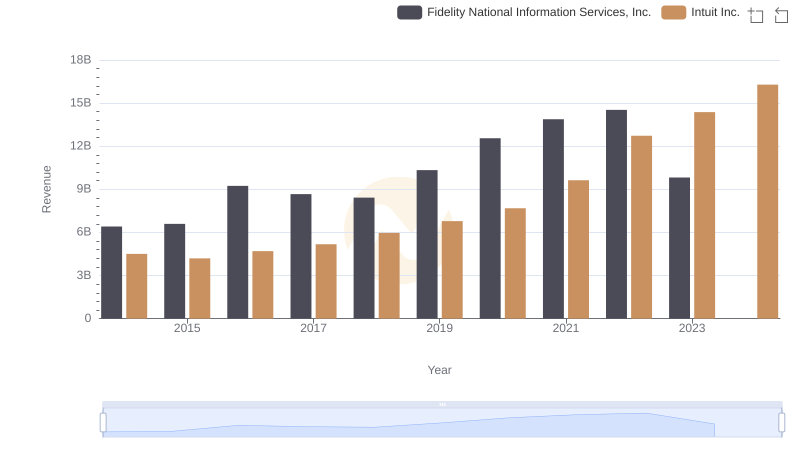
Revenue Insights: Intuit Inc. and Fidelity National Information Services, Inc. Performance Compared
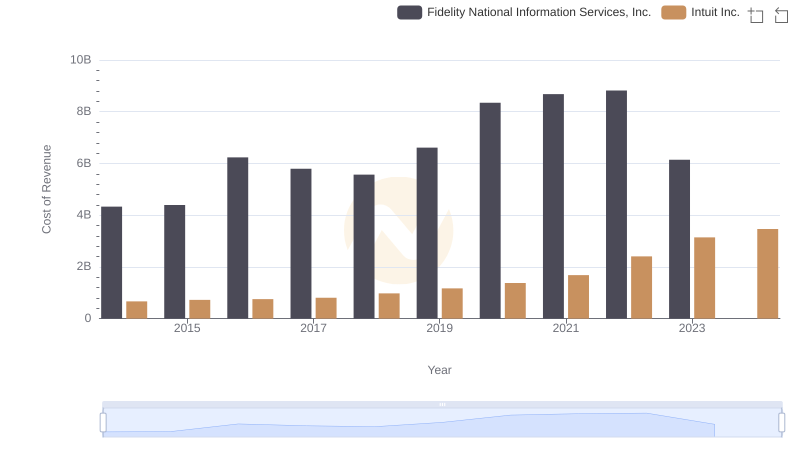
Intuit Inc. vs Fidelity National Information Services, Inc.: Efficiency in Cost of Revenue Explored
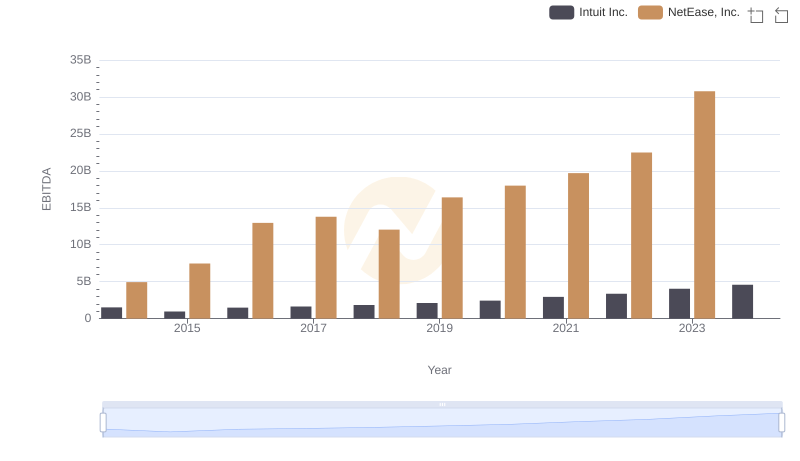
EBITDA Performance Review: Intuit Inc. vs NetEase, Inc.
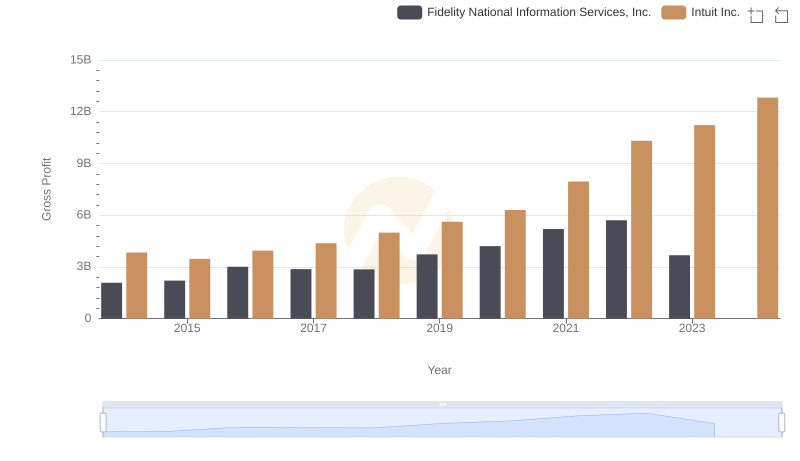
Gross Profit Analysis: Comparing Intuit Inc. and Fidelity National Information Services, Inc.
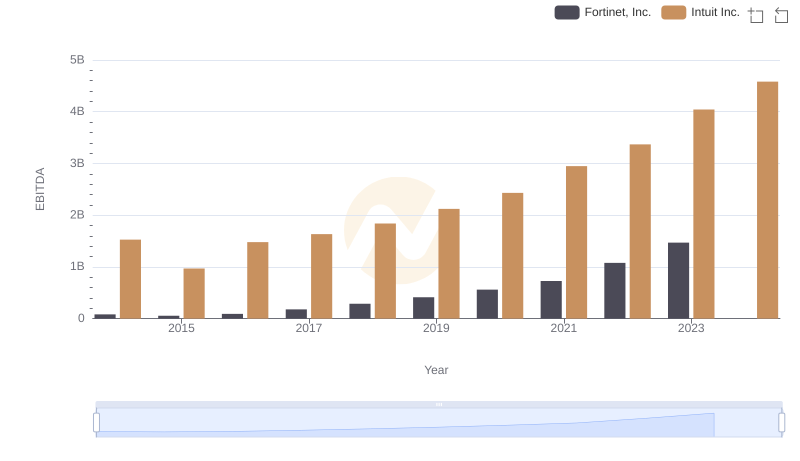
A Professional Review of EBITDA: Intuit Inc. Compared to Fortinet, Inc.
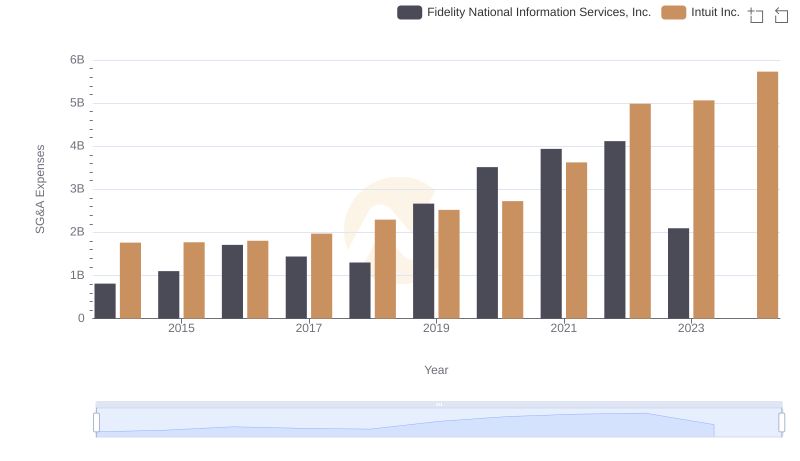
Comparing SG&A Expenses: Intuit Inc. vs Fidelity National Information Services, Inc. Trends and Insights
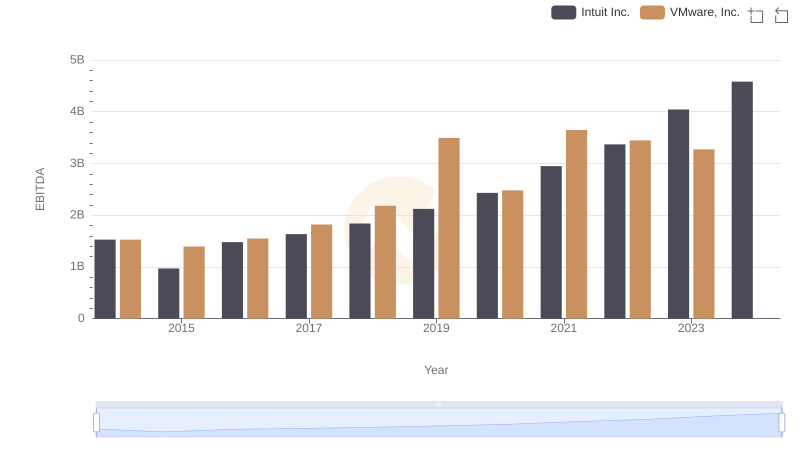
EBITDA Analysis: Evaluating Intuit Inc. Against VMware, Inc.
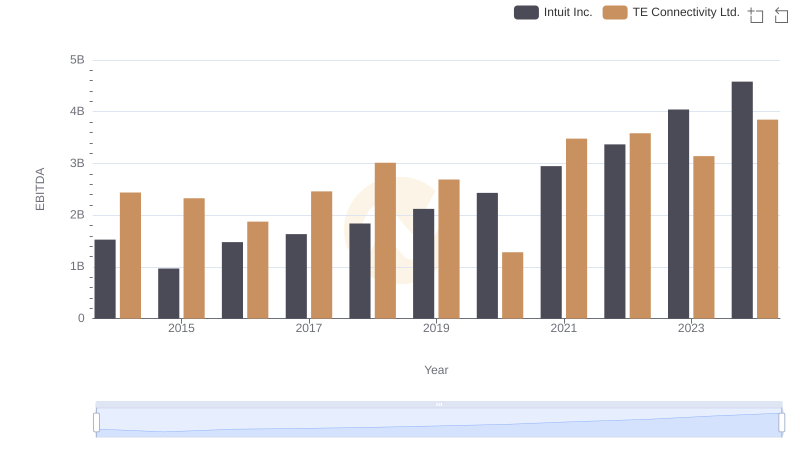
Intuit Inc. vs TE Connectivity Ltd.: In-Depth EBITDA Performance Comparison
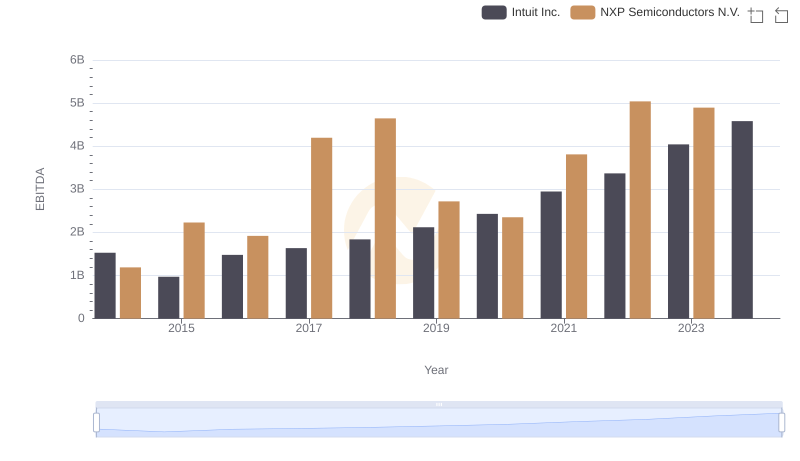
Professional EBITDA Benchmarking: Intuit Inc. vs NXP Semiconductors N.V.
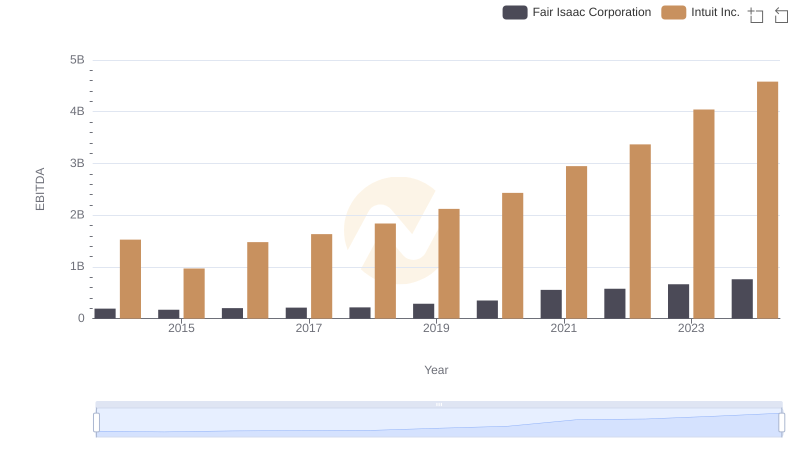
EBITDA Analysis: Evaluating Intuit Inc. Against Fair Isaac Corporation
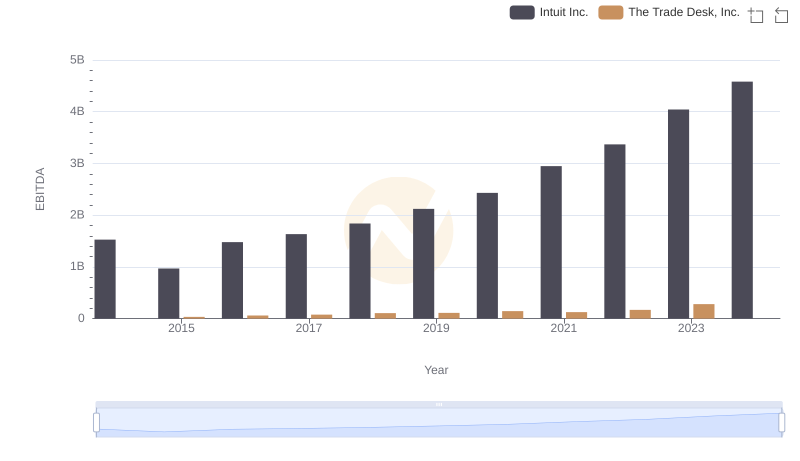
EBITDA Metrics Evaluated: Intuit Inc. vs The Trade Desk, Inc.
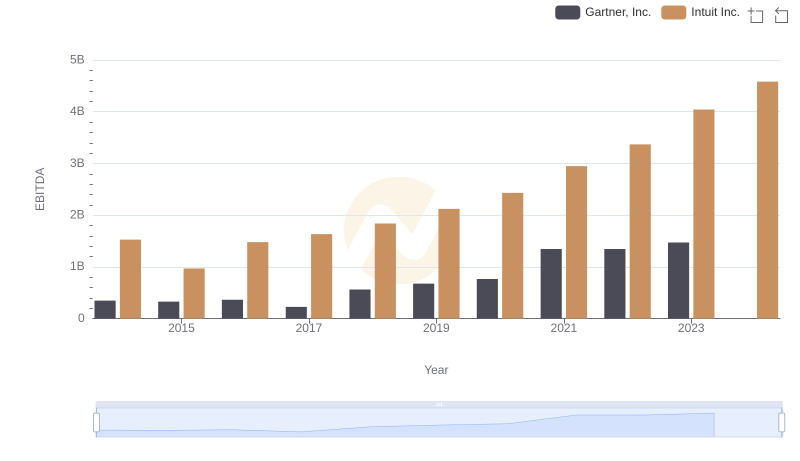
A Professional Review of EBITDA: Intuit Inc. Compared to Gartner, Inc.