| __timestamp | Intuit Inc. | TE Connectivity Ltd. |
|---|---|---|
| Wednesday, January 1, 2014 | 1528000000 | 2438000000 |
| Thursday, January 1, 2015 | 970000000 | 2327000000 |
| Friday, January 1, 2016 | 1480000000 | 1874000000 |
| Sunday, January 1, 2017 | 1634000000 | 2461000000 |
| Monday, January 1, 2018 | 1839000000 | 3014000000 |
| Tuesday, January 1, 2019 | 2121000000 | 2689000000 |
| Wednesday, January 1, 2020 | 2430000000 | 1283000000 |
| Friday, January 1, 2021 | 2948000000 | 3479000000 |
| Saturday, January 1, 2022 | 3369000000 | 3584000000 |
| Sunday, January 1, 2023 | 4043000000 | 3142000000 |
| Monday, January 1, 2024 | 4581000000 | 3848000000 |
Unleashing the power of data
In the ever-evolving landscape of global business, understanding the financial health of industry giants is crucial. Over the past decade, Intuit Inc. and TE Connectivity Ltd. have showcased intriguing EBITDA trends, reflecting their strategic maneuvers and market adaptability. From 2014 to 2024, Intuit's EBITDA surged by approximately 200%, highlighting its robust growth trajectory. In contrast, TE Connectivity experienced a more modest increase of around 58%, yet maintained a consistently higher EBITDA until 2022.
The year 2020 marked a pivotal point, with Intuit surpassing TE Connectivity for the first time, a testament to its resilience amid global economic challenges. By 2024, Intuit's EBITDA reached an impressive 4.58 billion, while TE Connectivity stood at 3.85 billion. This comparison not only underscores the dynamic nature of these corporations but also offers valuable insights into their strategic priorities and market positioning.
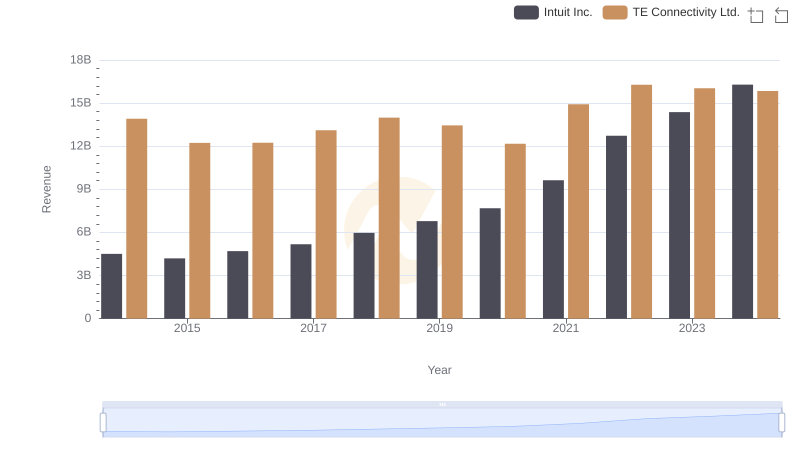
Annual Revenue Comparison: Intuit Inc. vs TE Connectivity Ltd.
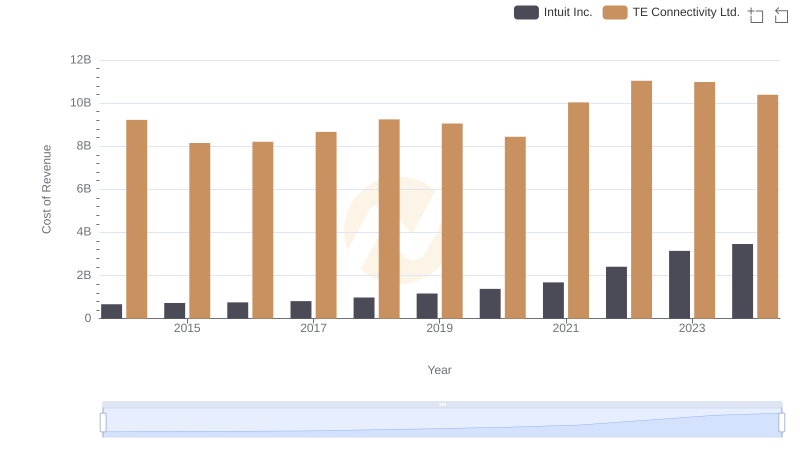
Cost of Revenue: Key Insights for Intuit Inc. and TE Connectivity Ltd.
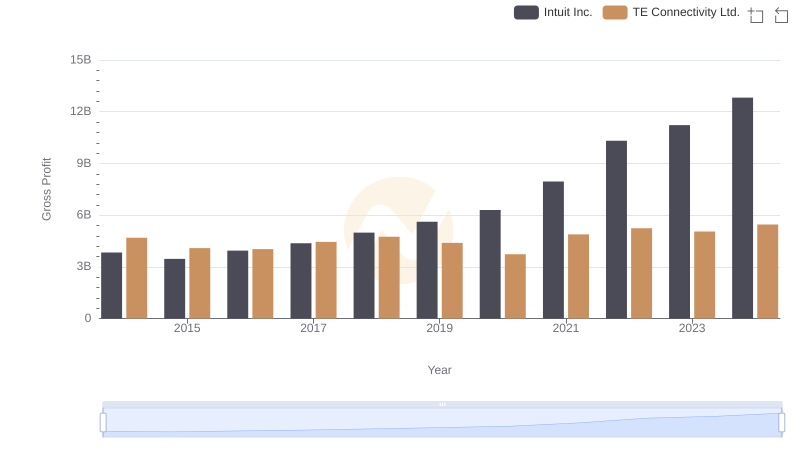
Intuit Inc. vs TE Connectivity Ltd.: A Gross Profit Performance Breakdown
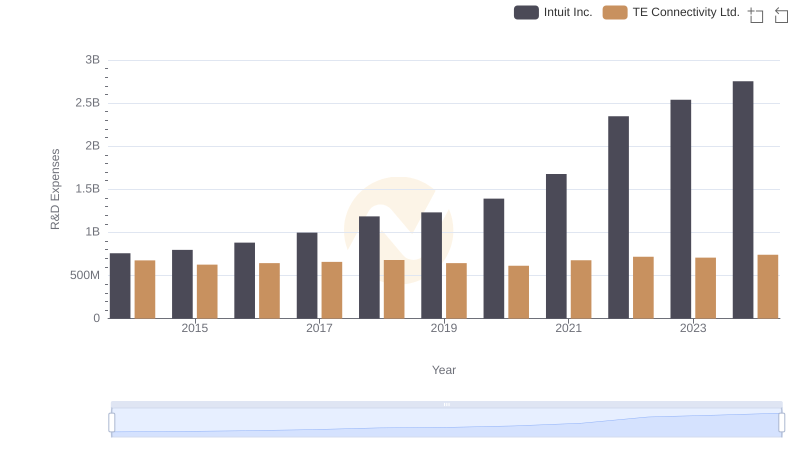
Intuit Inc. or TE Connectivity Ltd.: Who Invests More in Innovation?
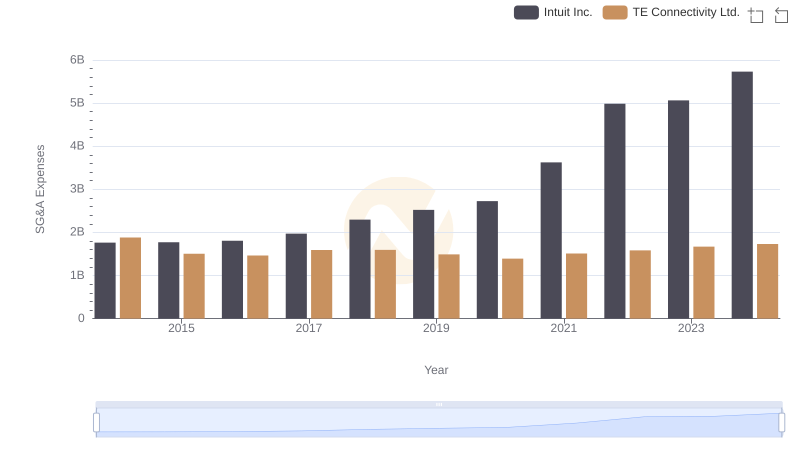
Cost Management Insights: SG&A Expenses for Intuit Inc. and TE Connectivity Ltd.
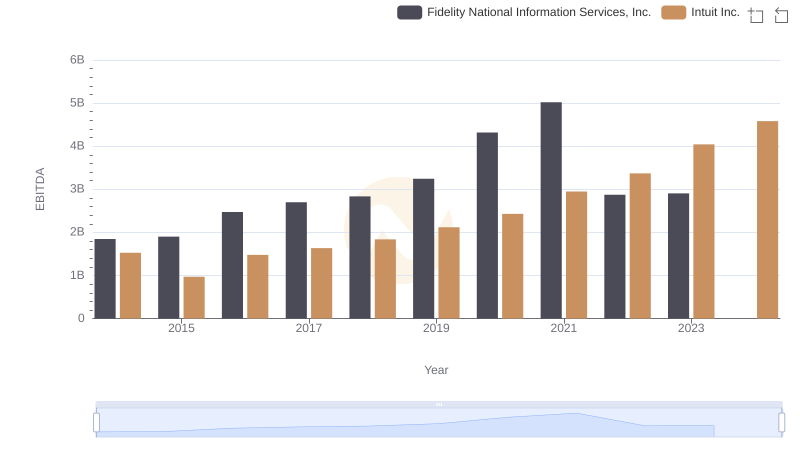
Comparative EBITDA Analysis: Intuit Inc. vs Fidelity National Information Services, Inc.
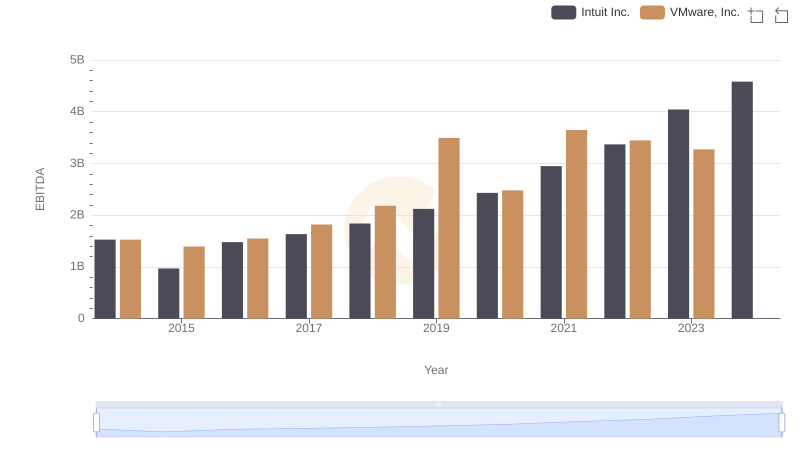
EBITDA Analysis: Evaluating Intuit Inc. Against VMware, Inc.
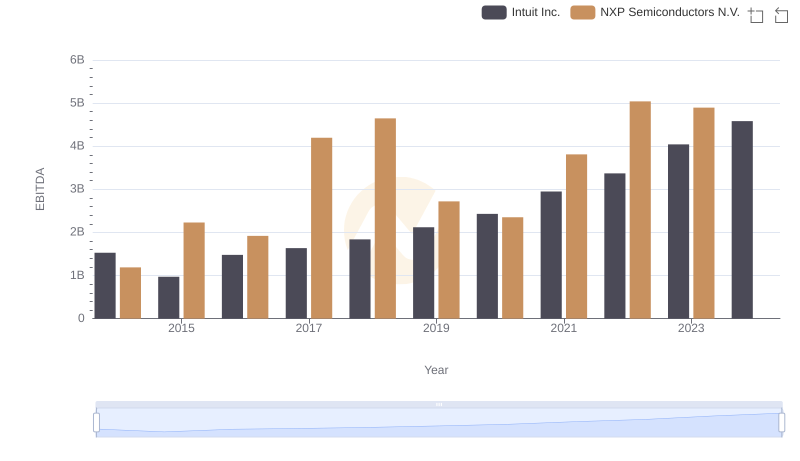
Professional EBITDA Benchmarking: Intuit Inc. vs NXP Semiconductors N.V.
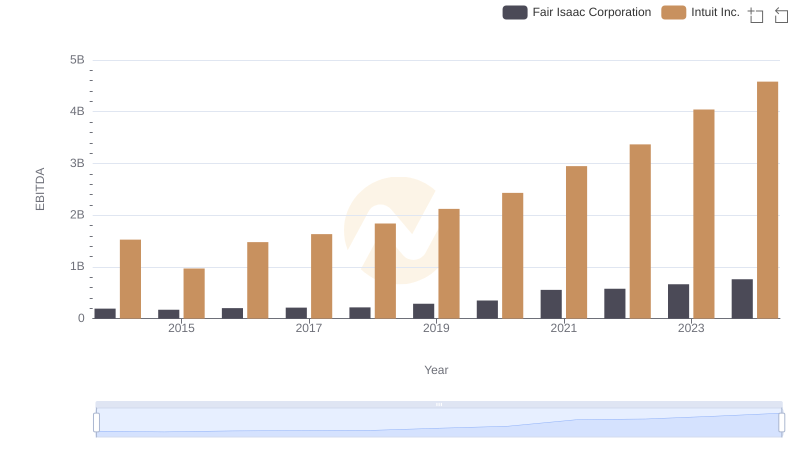
EBITDA Analysis: Evaluating Intuit Inc. Against Fair Isaac Corporation
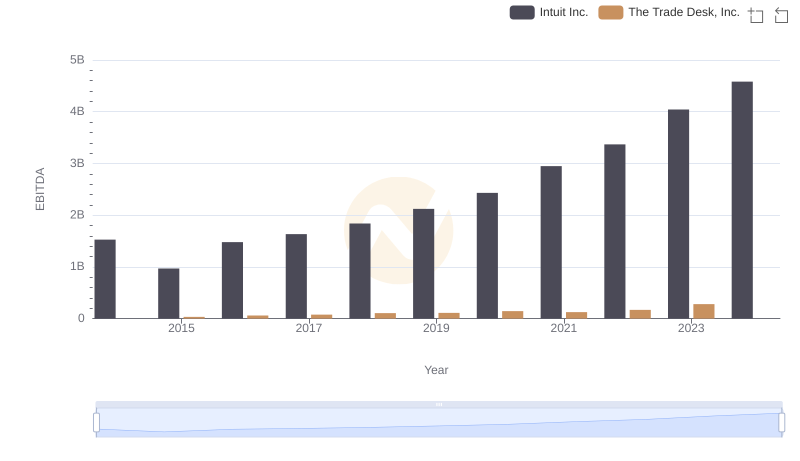
EBITDA Metrics Evaluated: Intuit Inc. vs The Trade Desk, Inc.
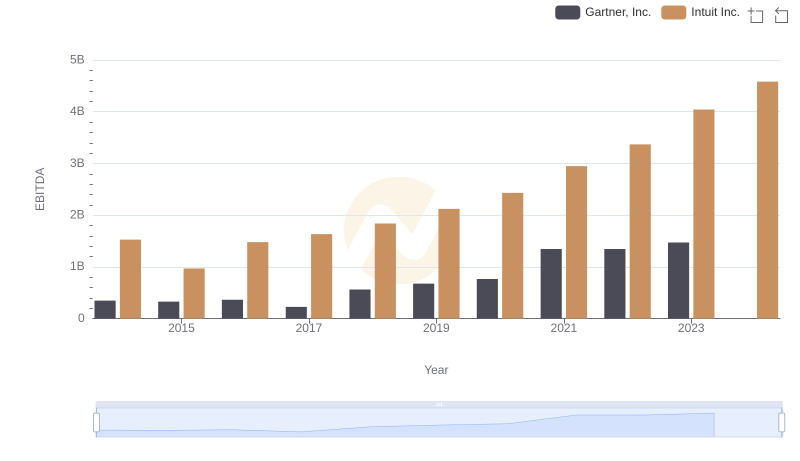
A Professional Review of EBITDA: Intuit Inc. Compared to Gartner, Inc.
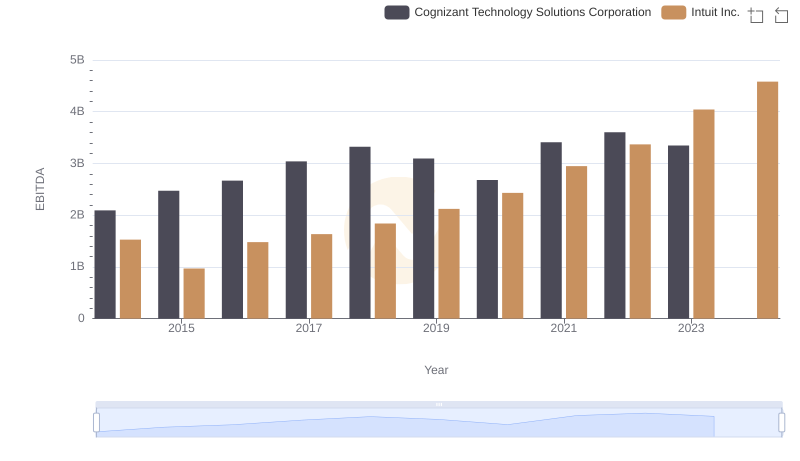
Comparative EBITDA Analysis: Intuit Inc. vs Cognizant Technology Solutions Corporation