| __timestamp | Intuit Inc. | NetEase, Inc. |
|---|---|---|
| Wednesday, January 1, 2014 | 4506000000 | 11712834000 |
| Thursday, January 1, 2015 | 4192000000 | 22802895000 |
| Friday, January 1, 2016 | 4694000000 | 38178844000 |
| Sunday, January 1, 2017 | 5177000000 | 54102019000 |
| Monday, January 1, 2018 | 5964000000 | 67156453000 |
| Tuesday, January 1, 2019 | 6784000000 | 59241145000 |
| Wednesday, January 1, 2020 | 7679000000 | 73667133000 |
| Friday, January 1, 2021 | 9633000000 | 87606026000 |
| Saturday, January 1, 2022 | 12726000000 | 96495809000 |
| Sunday, January 1, 2023 | 14368000000 | 103468159000 |
| Monday, January 1, 2024 | 16285000000 |
Unlocking the unknown
In the ever-evolving landscape of global business, Intuit Inc. and NetEase, Inc. have emerged as significant players, each carving out a unique niche. From 2014 to 2023, Intuit's revenue has shown a robust growth trajectory, increasing by approximately 260%. This reflects the company's strategic expansion in financial software solutions. Meanwhile, NetEase, a titan in the Chinese internet technology sector, has seen its revenue soar by nearly 780% over the same period, underscoring its dominance in online gaming and e-commerce.
While Intuit's revenue reached its peak in 2024, NetEase's data for the same year remains elusive, hinting at potential market shifts. This comparison not only highlights the dynamic nature of these industries but also offers a glimpse into the strategic maneuvers that have propelled these companies to the forefront of their respective fields.
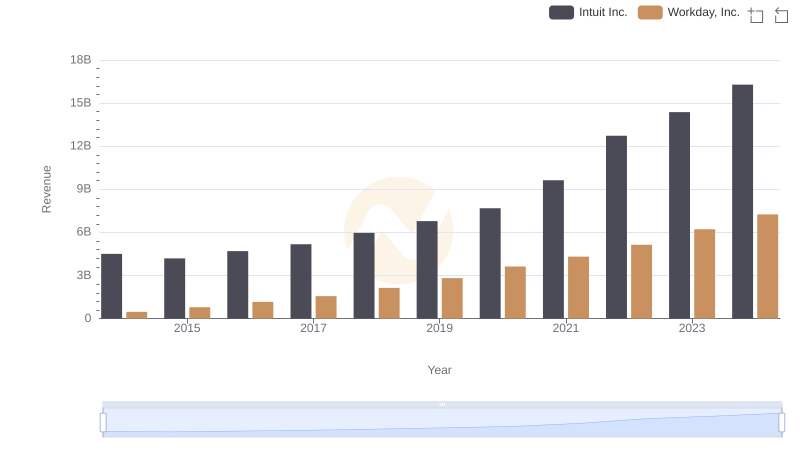
Intuit Inc. vs Workday, Inc.: Annual Revenue Growth Compared
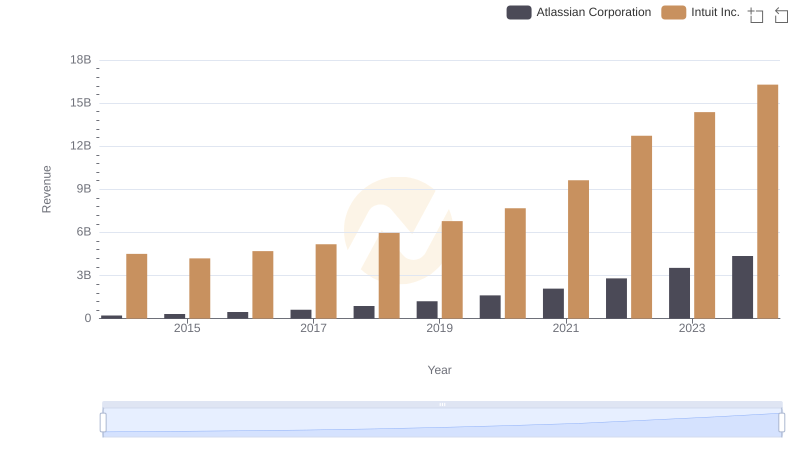
Who Generates More Revenue? Intuit Inc. or Atlassian Corporation
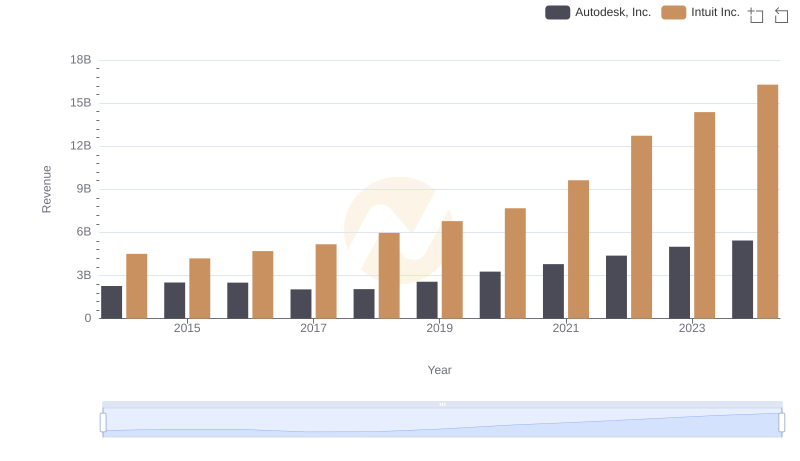
Revenue Showdown: Intuit Inc. vs Autodesk, Inc.
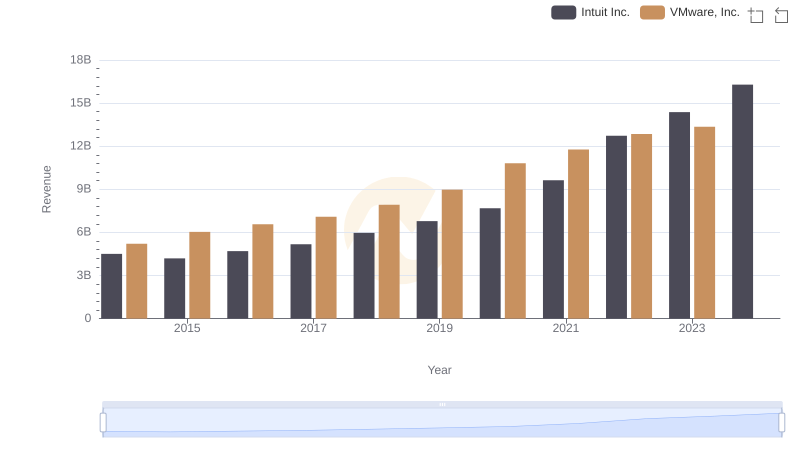
Intuit Inc. vs VMware, Inc.: Examining Key Revenue Metrics
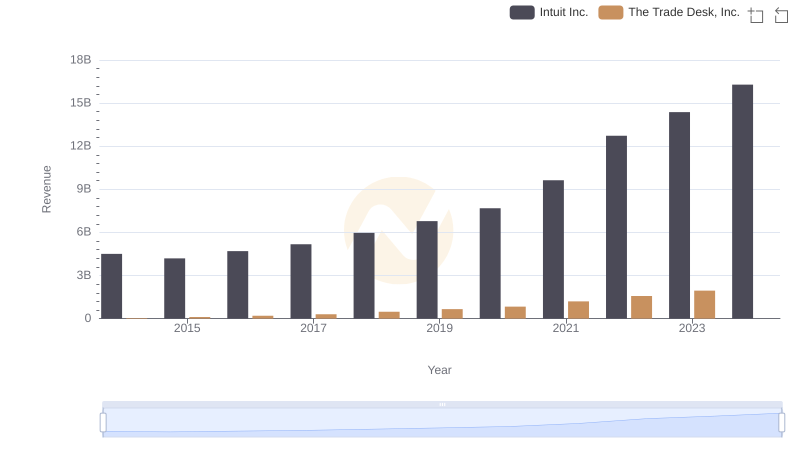
Revenue Insights: Intuit Inc. and The Trade Desk, Inc. Performance Compared
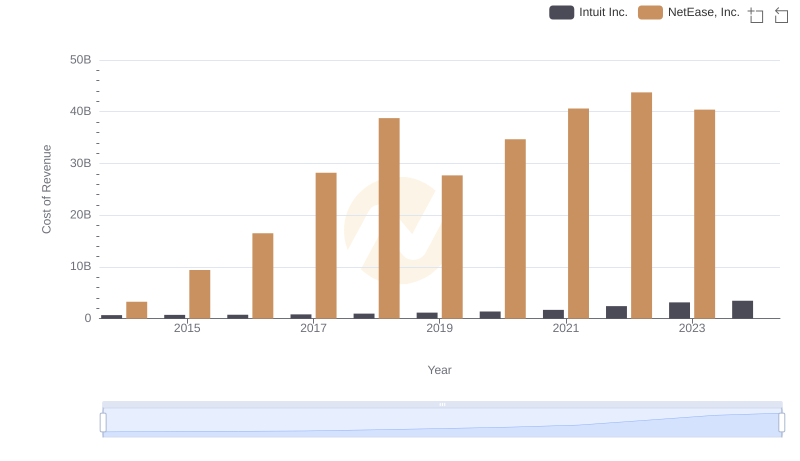
Cost of Revenue: Key Insights for Intuit Inc. and NetEase, Inc.
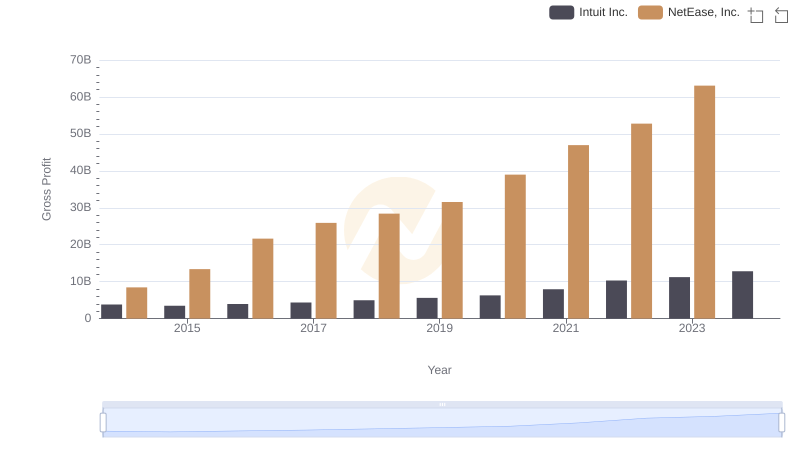
Who Generates Higher Gross Profit? Intuit Inc. or NetEase, Inc.
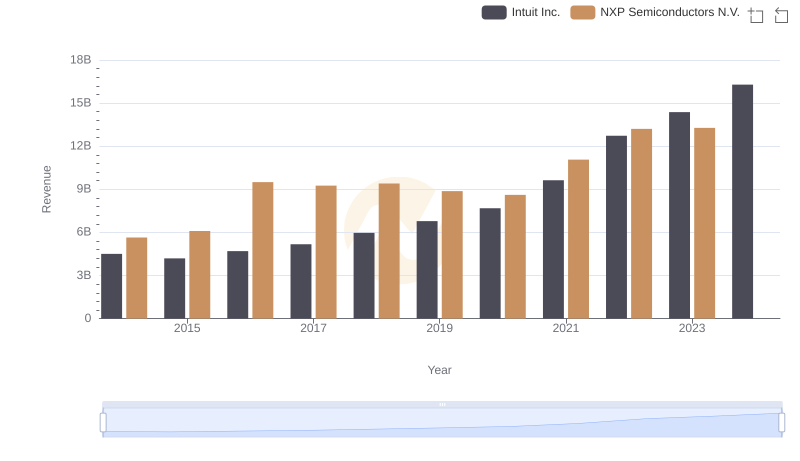
Intuit Inc. and NXP Semiconductors N.V.: A Comprehensive Revenue Analysis
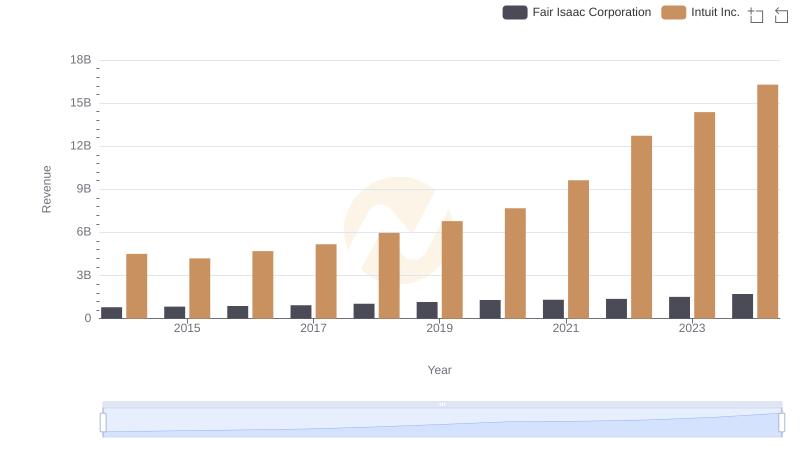
Revenue Insights: Intuit Inc. and Fair Isaac Corporation Performance Compared
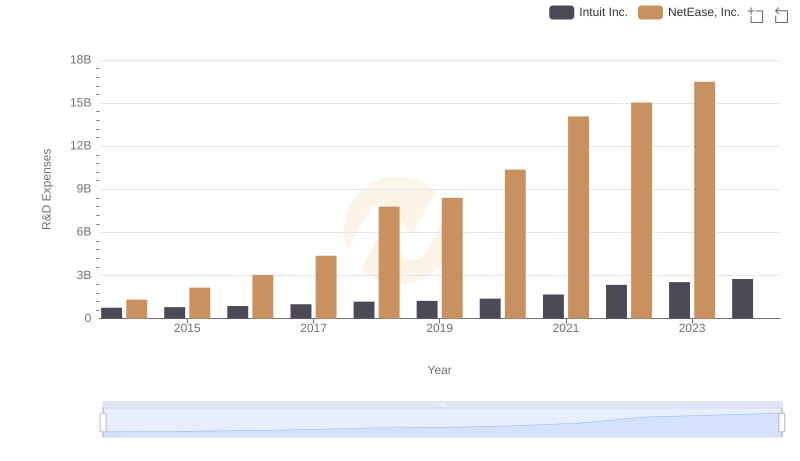
Research and Development Investment: Intuit Inc. vs NetEase, Inc.
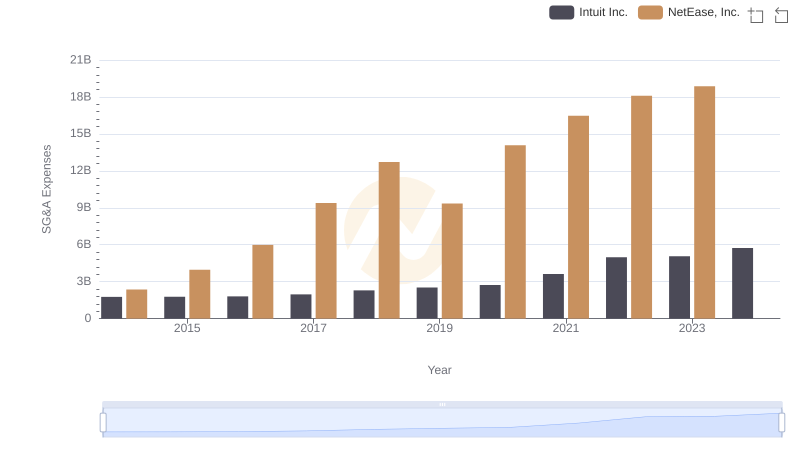
Breaking Down SG&A Expenses: Intuit Inc. vs NetEase, Inc.
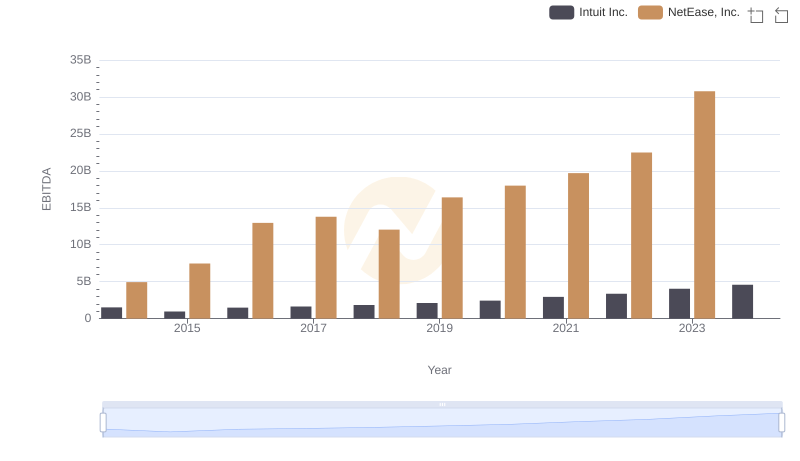
EBITDA Performance Review: Intuit Inc. vs NetEase, Inc.