| __timestamp | Fortinet, Inc. | Intuit Inc. |
|---|---|---|
| Wednesday, January 1, 2014 | 81352000 | 1528000000 |
| Thursday, January 1, 2015 | 55766000 | 970000000 |
| Friday, January 1, 2016 | 91668000 | 1480000000 |
| Sunday, January 1, 2017 | 179470000 | 1634000000 |
| Monday, January 1, 2018 | 286700000 | 1839000000 |
| Tuesday, January 1, 2019 | 412600000 | 2121000000 |
| Wednesday, January 1, 2020 | 560400000 | 2430000000 |
| Friday, January 1, 2021 | 727700000 | 2948000000 |
| Saturday, January 1, 2022 | 1077800000 | 3369000000 |
| Sunday, January 1, 2023 | 1468100000 | 4043000000 |
| Monday, January 1, 2024 | 1803400000 | 4581000000 |
Unleashing insights
In the ever-evolving landscape of technology, financial performance is a key indicator of a company's resilience and growth. Over the past decade, Intuit Inc. and Fortinet, Inc. have demonstrated remarkable trajectories in their EBITDA, a critical measure of profitability.
From 2014 to 2023, Intuit's EBITDA surged by approximately 165%, reflecting its robust business model and strategic innovations. In contrast, Fortinet's EBITDA skyrocketed by an impressive 1,700%, showcasing its rapid expansion in the cybersecurity sector. Notably, Intuit's EBITDA consistently outpaced Fortinet's, peaking at $4.043 billion in 2023, compared to Fortinet's $1.468 billion.
While Intuit's growth was steady, Fortinet's exponential rise highlights its aggressive market capture. However, the data for 2024 is incomplete, leaving room for speculation on future trends. This financial narrative underscores the dynamic nature of the tech industry and the diverse strategies companies employ to thrive.
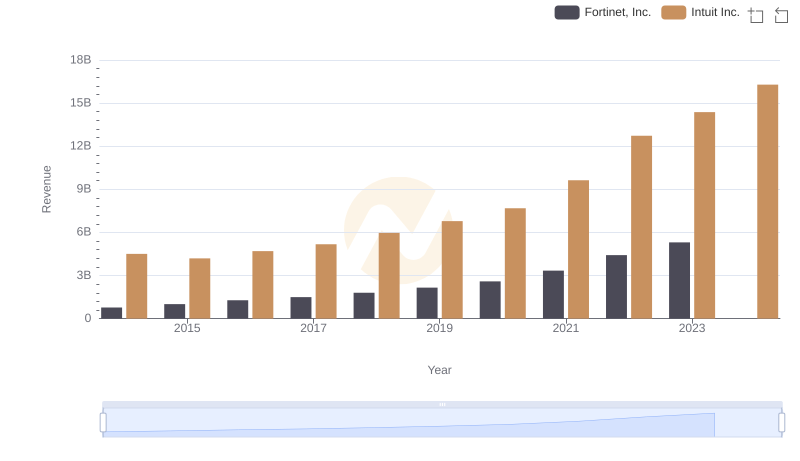
Intuit Inc. or Fortinet, Inc.: Who Leads in Yearly Revenue?
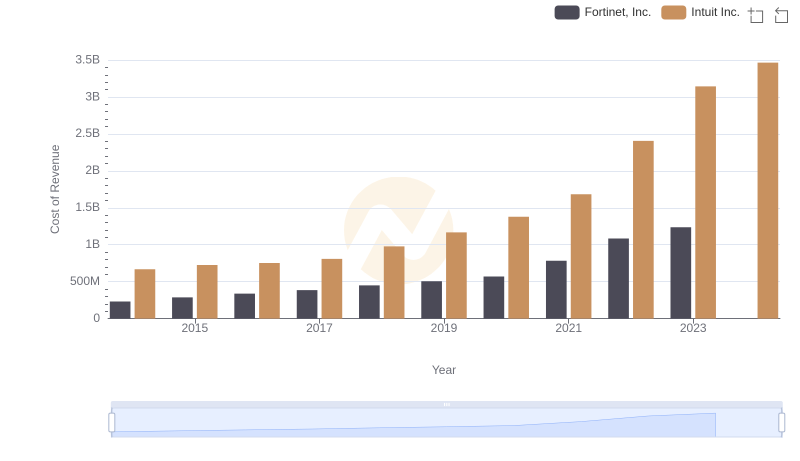
Comparing Cost of Revenue Efficiency: Intuit Inc. vs Fortinet, Inc.
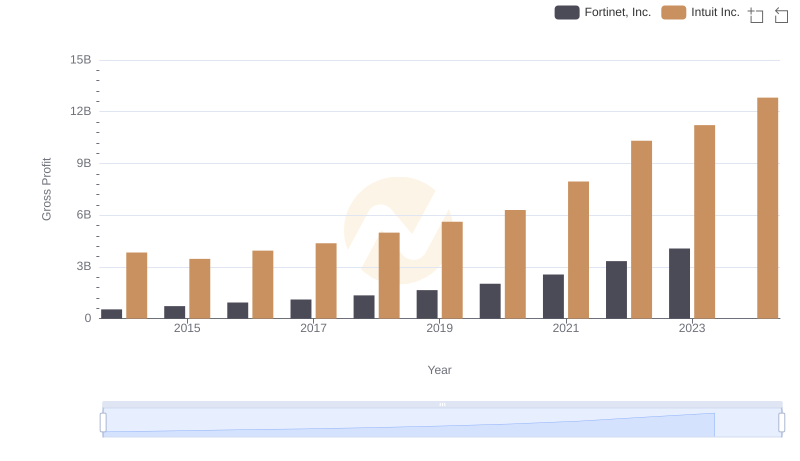
Intuit Inc. vs Fortinet, Inc.: A Gross Profit Performance Breakdown
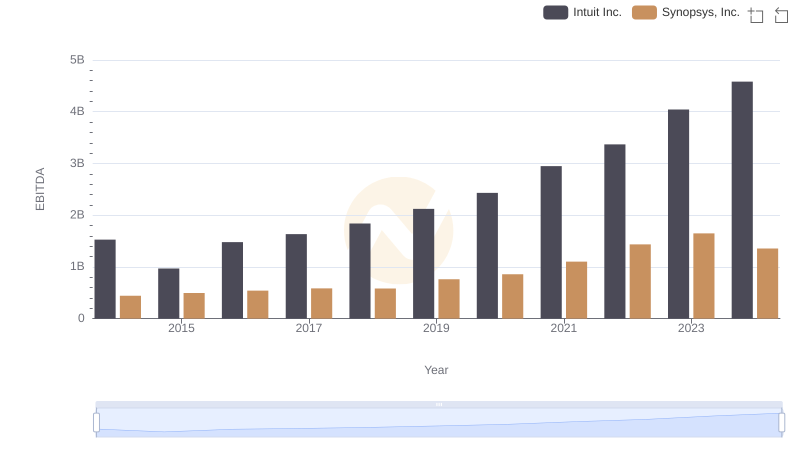
EBITDA Analysis: Evaluating Intuit Inc. Against Synopsys, Inc.
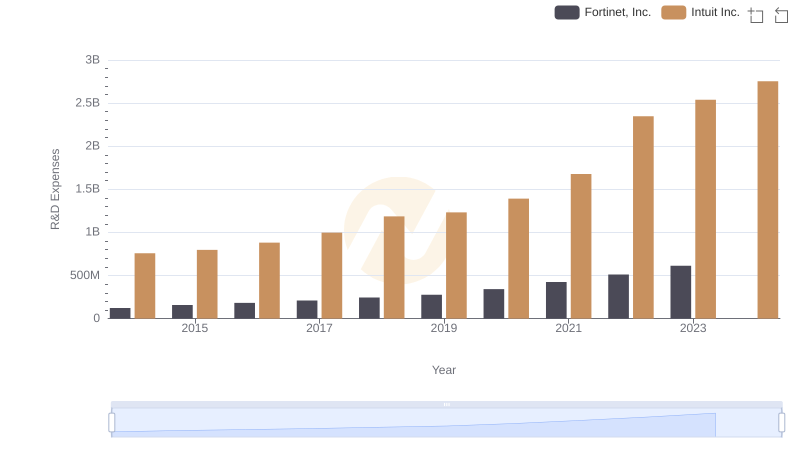
Intuit Inc. vs Fortinet, Inc.: Strategic Focus on R&D Spending
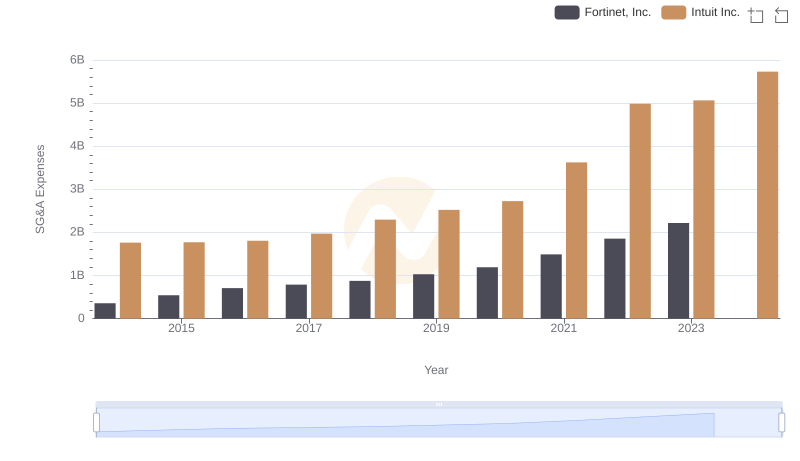
SG&A Efficiency Analysis: Comparing Intuit Inc. and Fortinet, Inc.
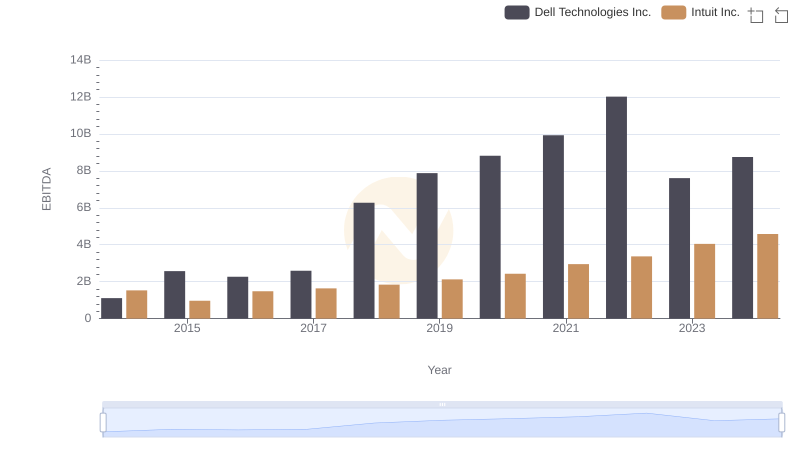
Intuit Inc. vs Dell Technologies Inc.: In-Depth EBITDA Performance Comparison
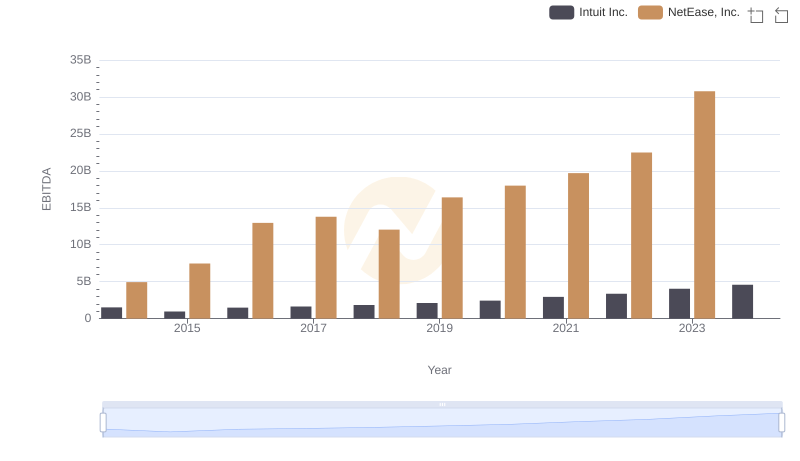
EBITDA Performance Review: Intuit Inc. vs NetEase, Inc.
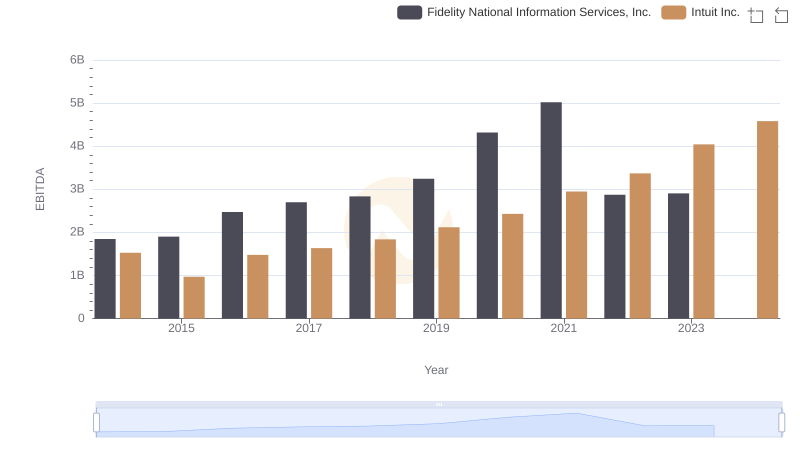
Comparative EBITDA Analysis: Intuit Inc. vs Fidelity National Information Services, Inc.
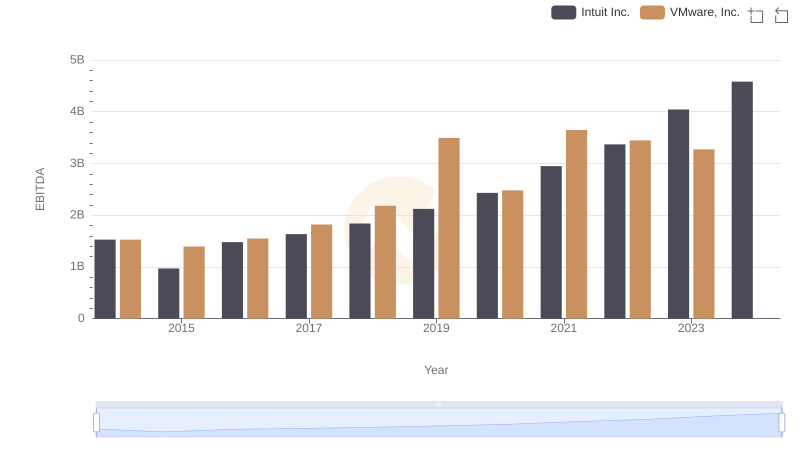
EBITDA Analysis: Evaluating Intuit Inc. Against VMware, Inc.
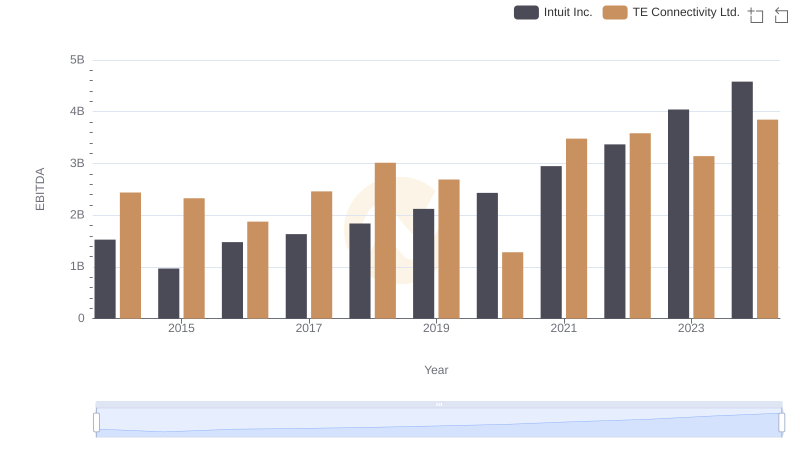
Intuit Inc. vs TE Connectivity Ltd.: In-Depth EBITDA Performance Comparison
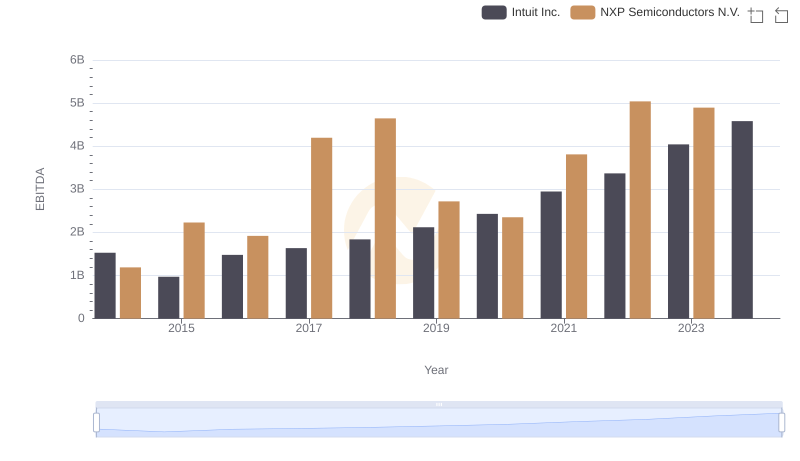
Professional EBITDA Benchmarking: Intuit Inc. vs NXP Semiconductors N.V.