| __timestamp | Intuit Inc. | VMware, Inc. |
|---|---|---|
| Wednesday, January 1, 2014 | 1528000000 | 1526000000 |
| Thursday, January 1, 2015 | 970000000 | 1395000000 |
| Friday, January 1, 2016 | 1480000000 | 1548000000 |
| Sunday, January 1, 2017 | 1634000000 | 1819000000 |
| Monday, January 1, 2018 | 1839000000 | 2181000000 |
| Tuesday, January 1, 2019 | 2121000000 | 3495000000 |
| Wednesday, January 1, 2020 | 2430000000 | 2479000000 |
| Friday, January 1, 2021 | 2948000000 | 3646000000 |
| Saturday, January 1, 2022 | 3369000000 | 3446000000 |
| Sunday, January 1, 2023 | 4043000000 | 3273000000 |
| Monday, January 1, 2024 | 4581000000 |
Unlocking the unknown
Over the past decade, Intuit Inc. and VMware, Inc. have been titans in the tech industry, each showcasing impressive EBITDA growth. From 2014 to 2023, Intuit's EBITDA surged by approximately 200%, reflecting its robust financial health and strategic market positioning. In contrast, VMware experienced a 115% increase, highlighting its steady performance despite market challenges.
In 2014, both companies started with similar EBITDA figures, around $1.5 billion. However, by 2023, Intuit's EBITDA had soared to over $4 billion, while VMware peaked at $3.6 billion in 2021 before slightly declining. This trend underscores Intuit's consistent upward trajectory, while VMware faced fluctuations.
Notably, VMware's 2024 data is absent, suggesting potential reporting delays or strategic shifts. This gap invites speculation about VMware's future financial strategies and market adaptations.
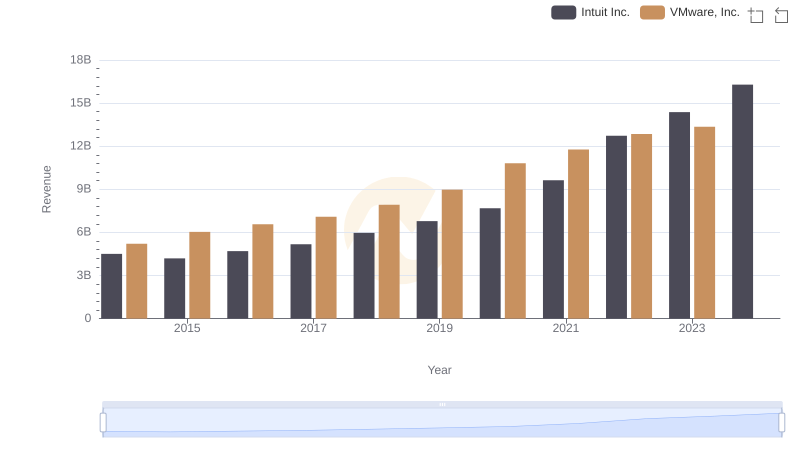
Intuit Inc. vs VMware, Inc.: Examining Key Revenue Metrics
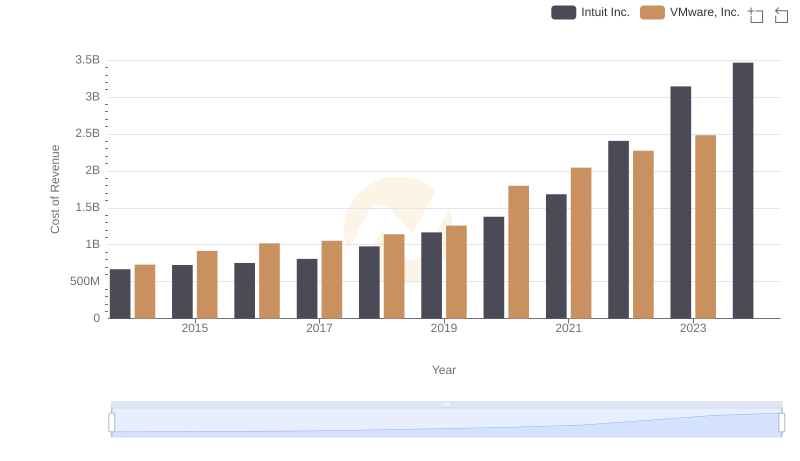
Analyzing Cost of Revenue: Intuit Inc. and VMware, Inc.
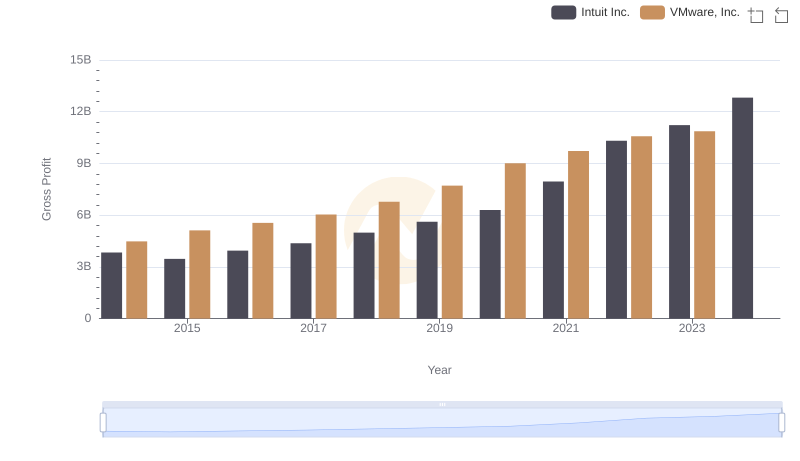
Intuit Inc. and VMware, Inc.: A Detailed Gross Profit Analysis
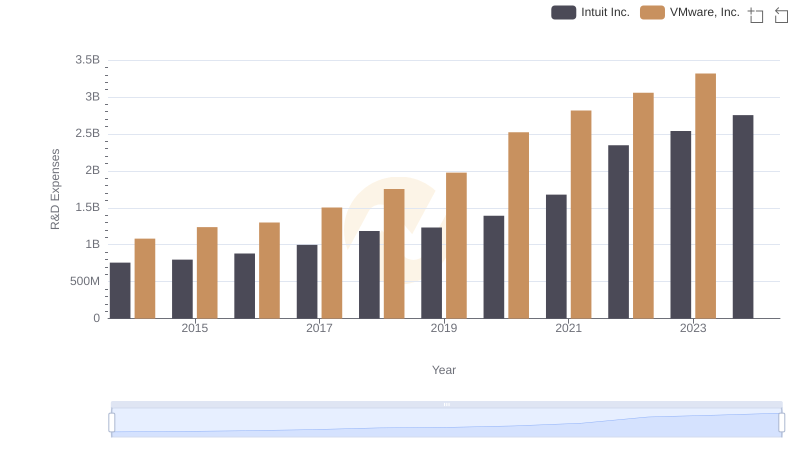
Intuit Inc. or VMware, Inc.: Who Invests More in Innovation?
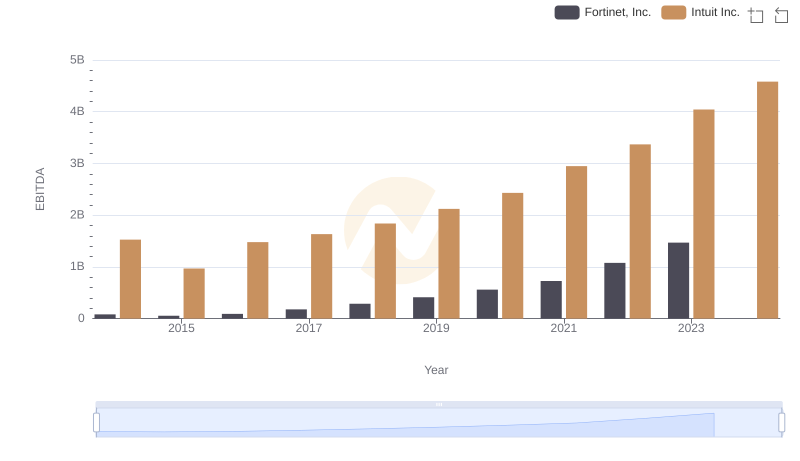
A Professional Review of EBITDA: Intuit Inc. Compared to Fortinet, Inc.
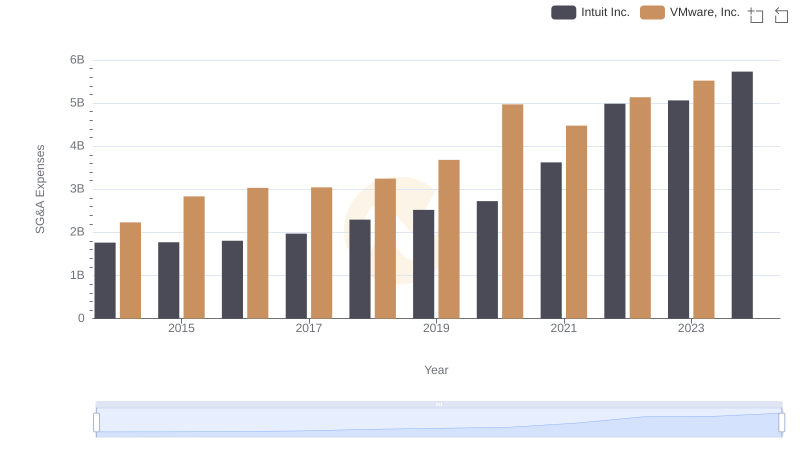
Cost Management Insights: SG&A Expenses for Intuit Inc. and VMware, Inc.
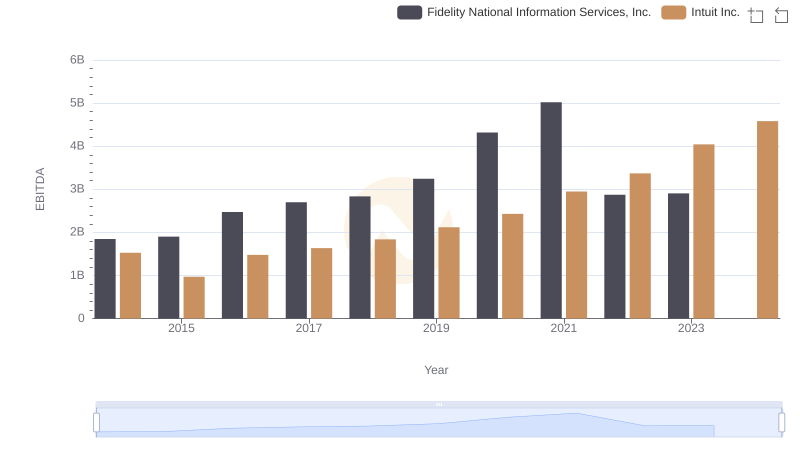
Comparative EBITDA Analysis: Intuit Inc. vs Fidelity National Information Services, Inc.
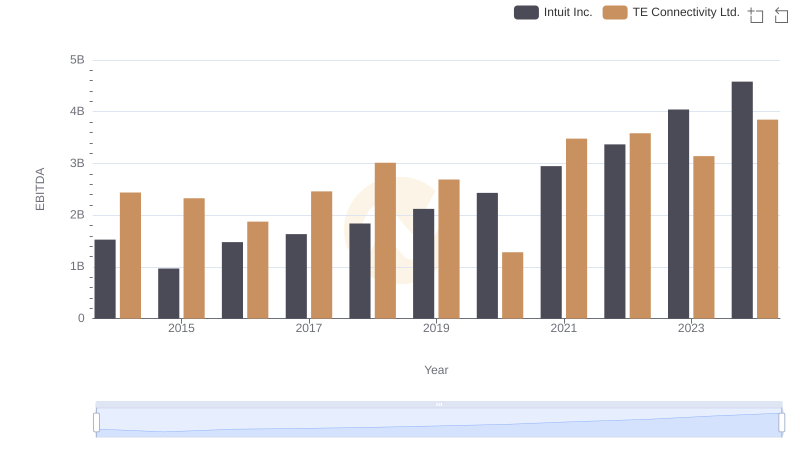
Intuit Inc. vs TE Connectivity Ltd.: In-Depth EBITDA Performance Comparison
Professional EBITDA Benchmarking: Intuit Inc. vs NXP Semiconductors N.V.
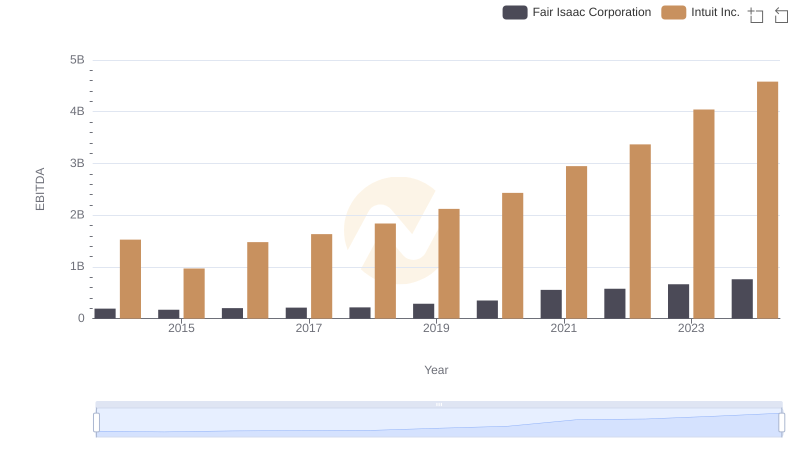
EBITDA Analysis: Evaluating Intuit Inc. Against Fair Isaac Corporation
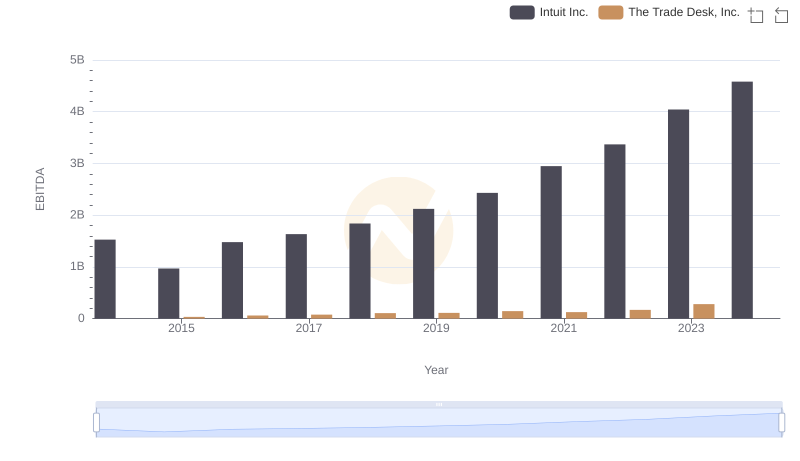
EBITDA Metrics Evaluated: Intuit Inc. vs The Trade Desk, Inc.
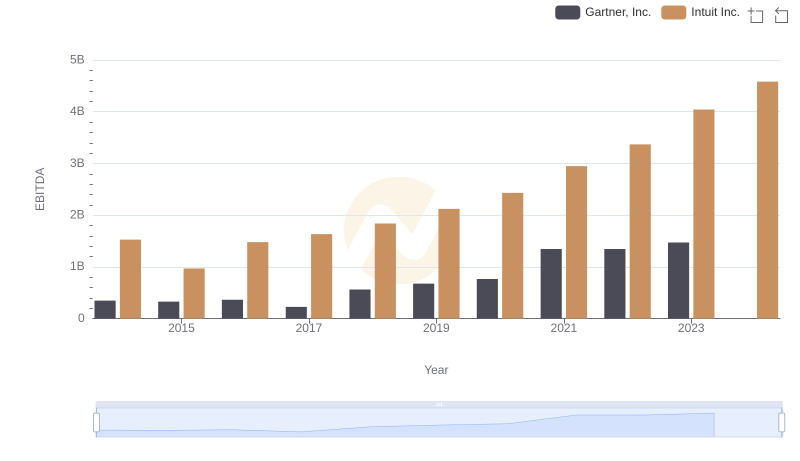
A Professional Review of EBITDA: Intuit Inc. Compared to Gartner, Inc.