| __timestamp | Intuit Inc. | NetEase, Inc. |
|---|---|---|
| Wednesday, January 1, 2014 | 668000000 | 3261544000 |
| Thursday, January 1, 2015 | 725000000 | 9399260000 |
| Friday, January 1, 2016 | 752000000 | 16515032000 |
| Sunday, January 1, 2017 | 809000000 | 28189326000 |
| Monday, January 1, 2018 | 977000000 | 38752957000 |
| Tuesday, January 1, 2019 | 1167000000 | 27685845000 |
| Wednesday, January 1, 2020 | 1378000000 | 34683731000 |
| Friday, January 1, 2021 | 1683000000 | 40635225000 |
| Saturday, January 1, 2022 | 2406000000 | 43729683000 |
| Sunday, January 1, 2023 | 3143000000 | 40404765000 |
| Monday, January 1, 2024 | 3465000000 |
Unleashing the power of data
In the ever-evolving landscape of global business, understanding the cost of revenue is crucial for evaluating a company's financial health. This analysis delves into the cost of revenue trends for Intuit Inc. and NetEase, Inc. from 2014 to 2023.
Intuit Inc., a leader in financial software, has seen its cost of revenue grow by over 400% from 2014 to 2023, reflecting its expanding market presence and product offerings. In contrast, NetEase, Inc., a major player in the Chinese internet technology sector, experienced a staggering increase of over 1,100% in its cost of revenue from 2014 to 2022, highlighting its aggressive growth strategy in the digital entertainment and e-commerce sectors.
Interestingly, while Intuit's cost of revenue continued to rise in 2023, NetEase's data for the same year is missing, leaving room for speculation about its financial strategies and market conditions.
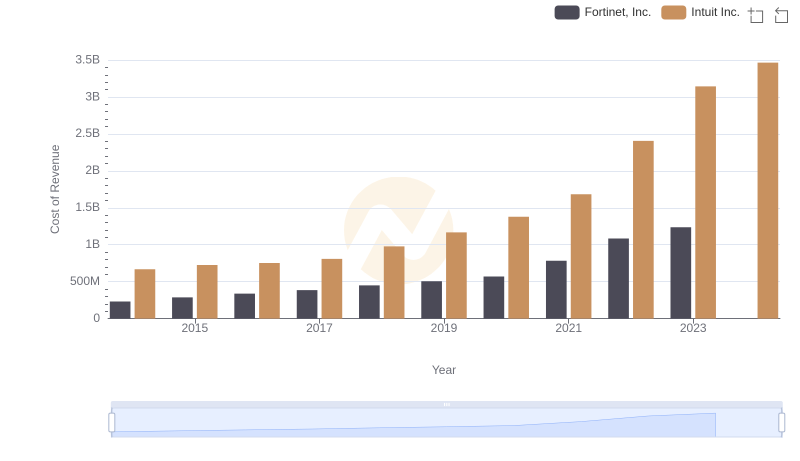
Comparing Cost of Revenue Efficiency: Intuit Inc. vs Fortinet, Inc.
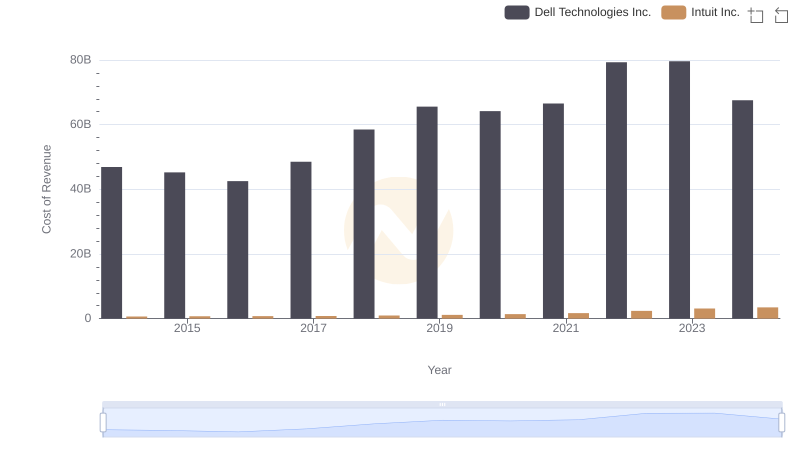
Cost of Revenue: Key Insights for Intuit Inc. and Dell Technologies Inc.
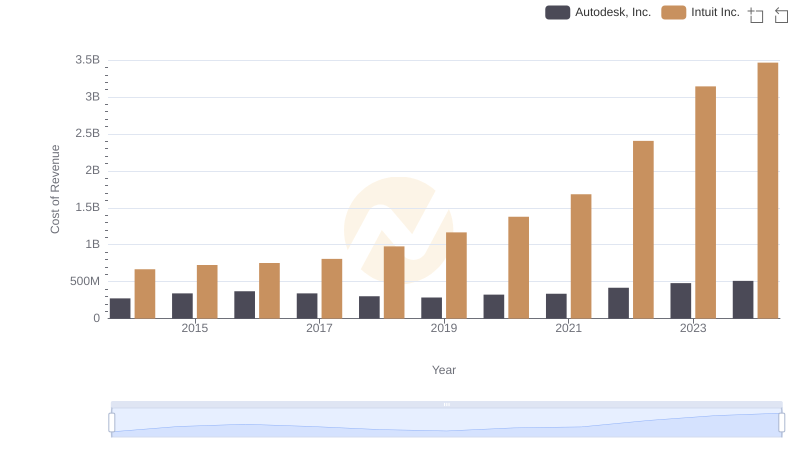
Cost of Revenue: Key Insights for Intuit Inc. and Autodesk, Inc.
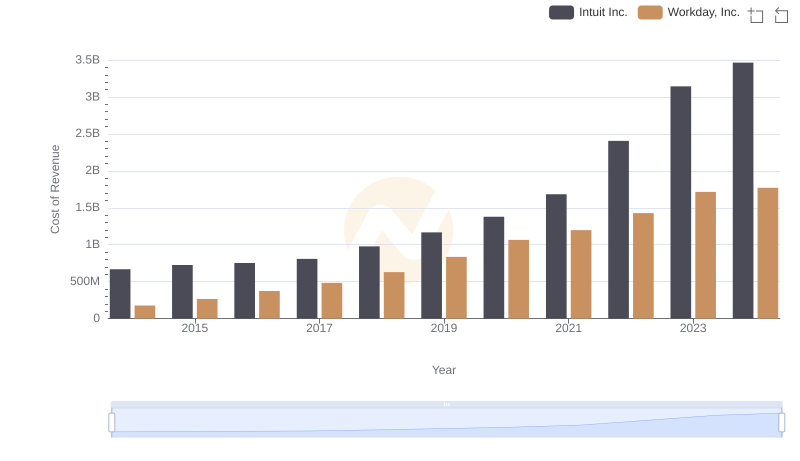
Comparing Cost of Revenue Efficiency: Intuit Inc. vs Workday, Inc.
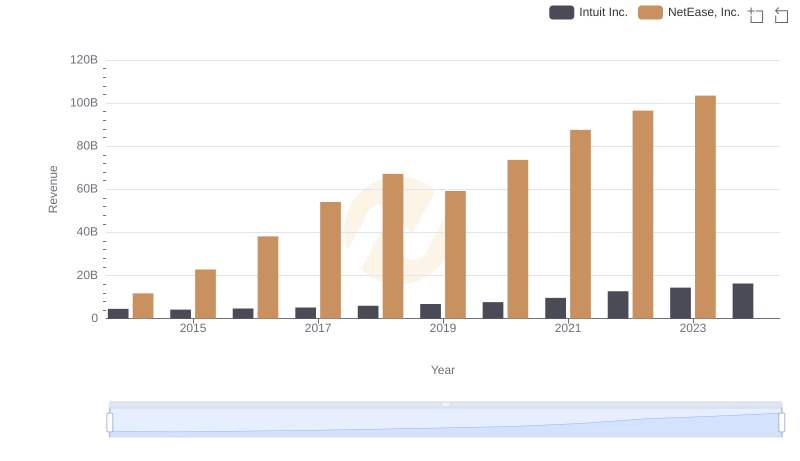
Breaking Down Revenue Trends: Intuit Inc. vs NetEase, Inc.
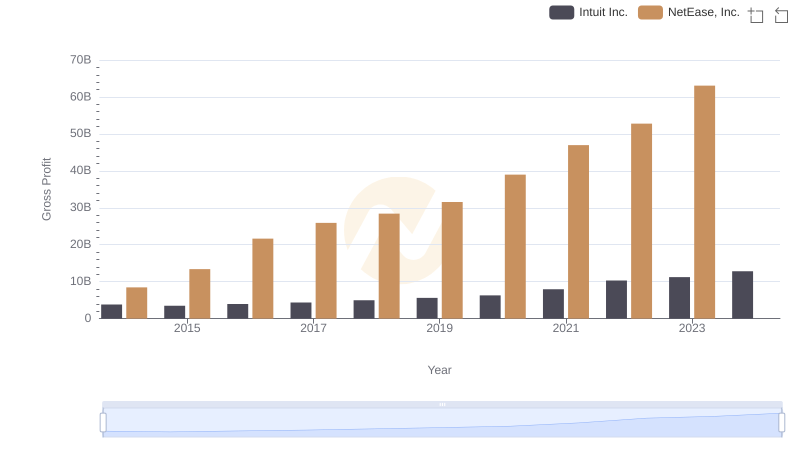
Who Generates Higher Gross Profit? Intuit Inc. or NetEase, Inc.
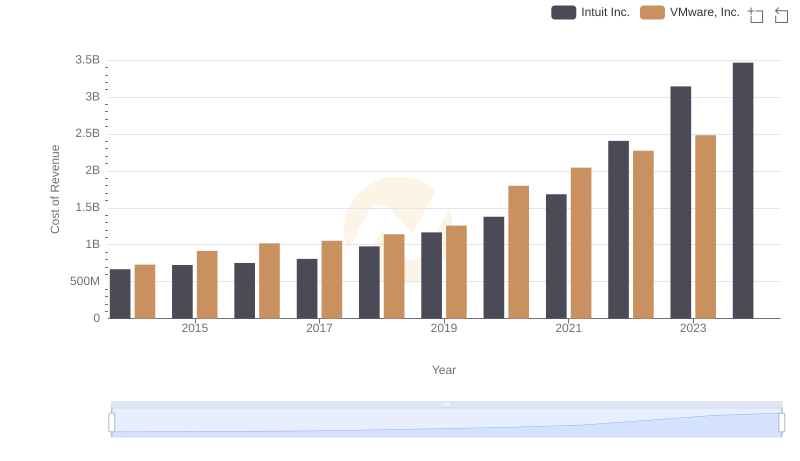
Analyzing Cost of Revenue: Intuit Inc. and VMware, Inc.
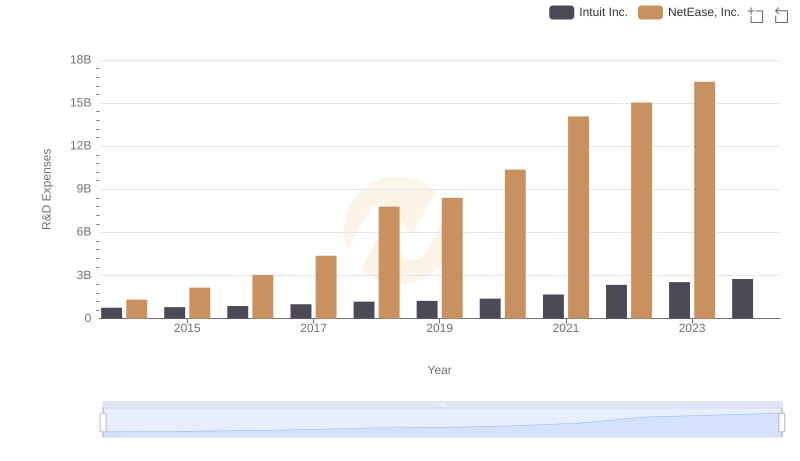
Research and Development Investment: Intuit Inc. vs NetEase, Inc.
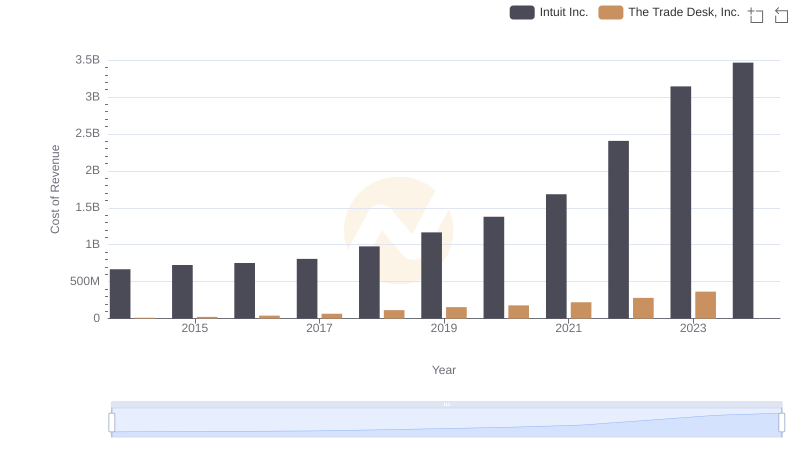
Intuit Inc. vs The Trade Desk, Inc.: Efficiency in Cost of Revenue Explored
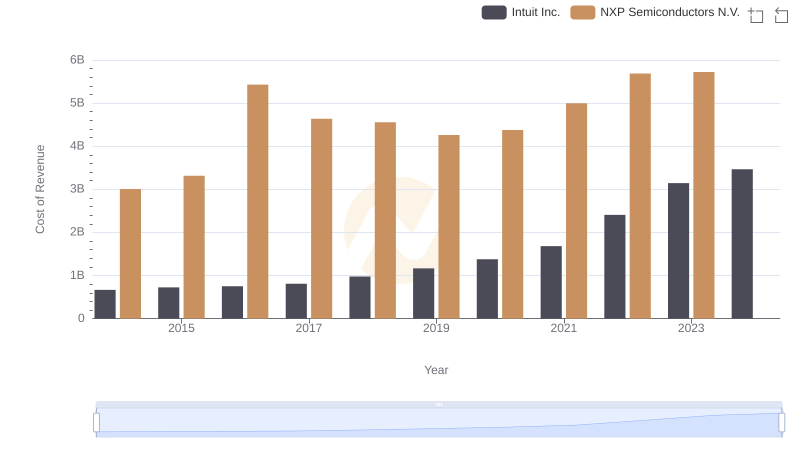
Comparing Cost of Revenue Efficiency: Intuit Inc. vs NXP Semiconductors N.V.
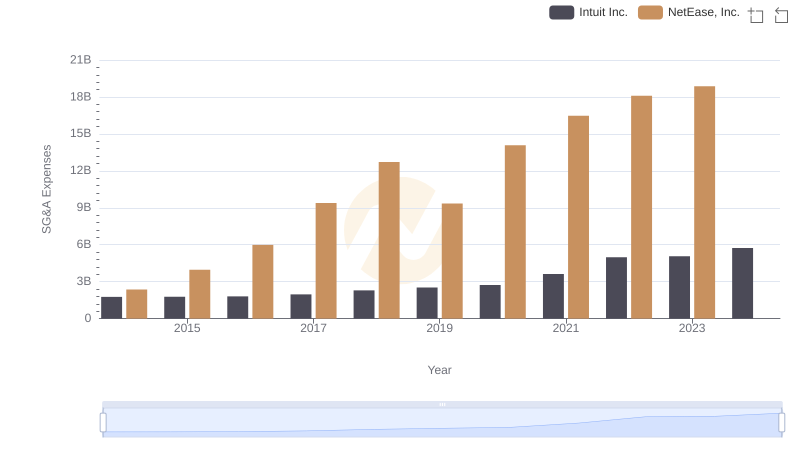
Breaking Down SG&A Expenses: Intuit Inc. vs NetEase, Inc.
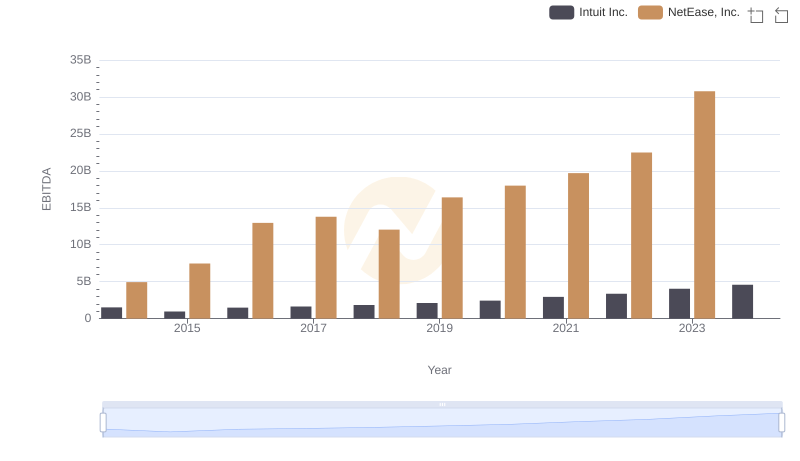
EBITDA Performance Review: Intuit Inc. vs NetEase, Inc.