| __timestamp | Dell Technologies Inc. | Intuit Inc. |
|---|---|---|
| Wednesday, January 1, 2014 | 1108000000 | 1528000000 |
| Thursday, January 1, 2015 | 2569000000 | 970000000 |
| Friday, January 1, 2016 | 2266000000 | 1480000000 |
| Sunday, January 1, 2017 | 2591000000 | 1634000000 |
| Monday, January 1, 2018 | 6271000000 | 1839000000 |
| Tuesday, January 1, 2019 | 7873000000 | 2121000000 |
| Wednesday, January 1, 2020 | 8814000000 | 2430000000 |
| Friday, January 1, 2021 | 9925000000 | 2948000000 |
| Saturday, January 1, 2022 | 12016000000 | 3369000000 |
| Sunday, January 1, 2023 | 7603000000 | 4043000000 |
| Monday, January 1, 2024 | 8746000000 | 4581000000 |
Infusing magic into the data realm
In the ever-evolving landscape of technology giants, the EBITDA performance of Intuit Inc. and Dell Technologies Inc. from 2014 to 2024 offers a fascinating glimpse into their financial trajectories. Over this decade, Dell Technologies has consistently outperformed Intuit, with its EBITDA peaking at approximately $12 billion in 2022, a staggering 160% increase from 2014. Meanwhile, Intuit's EBITDA has shown a steady upward trend, reaching nearly $4.6 billion in 2024, marking a 200% growth since 2014.
Dell's significant leap in 2018, with a 142% increase from the previous year, underscores its strategic maneuvers in the tech industry. Intuit, on the other hand, has demonstrated resilience and consistent growth, particularly notable in the 2020s. This comparison not only highlights the dynamic nature of the tech sector but also the strategic differences between these two industry leaders.
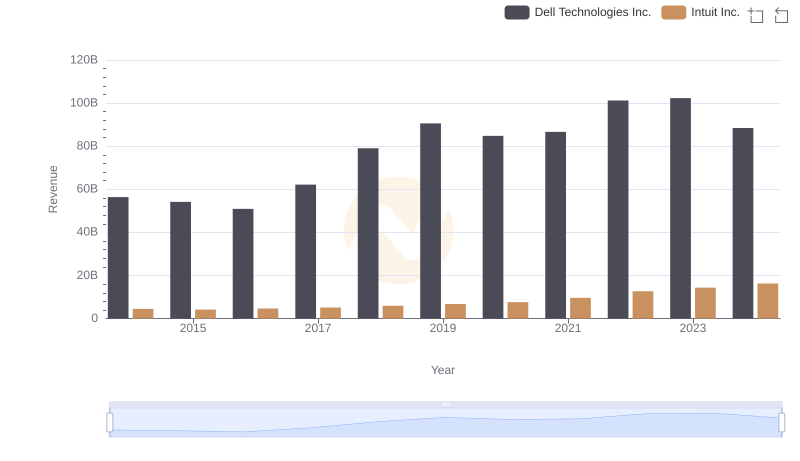
Intuit Inc. or Dell Technologies Inc.: Who Leads in Yearly Revenue?
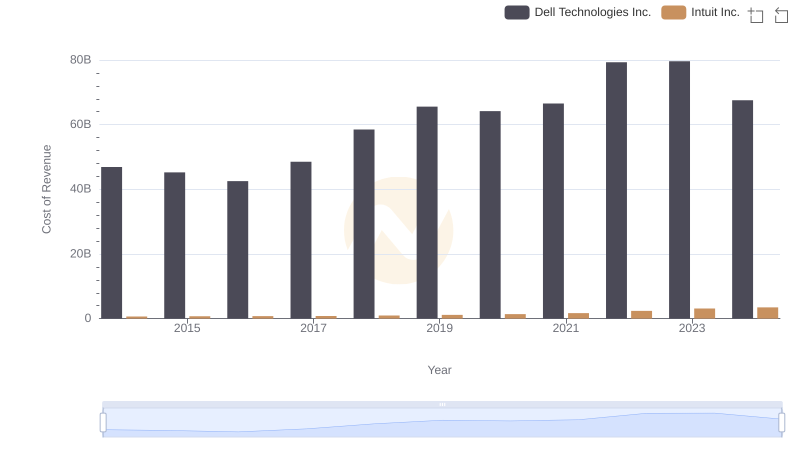
Cost of Revenue: Key Insights for Intuit Inc. and Dell Technologies Inc.
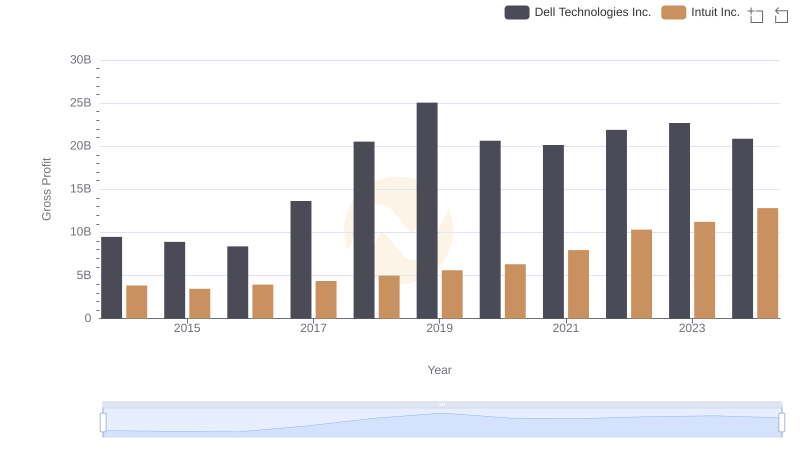
Intuit Inc. and Dell Technologies Inc.: A Detailed Gross Profit Analysis
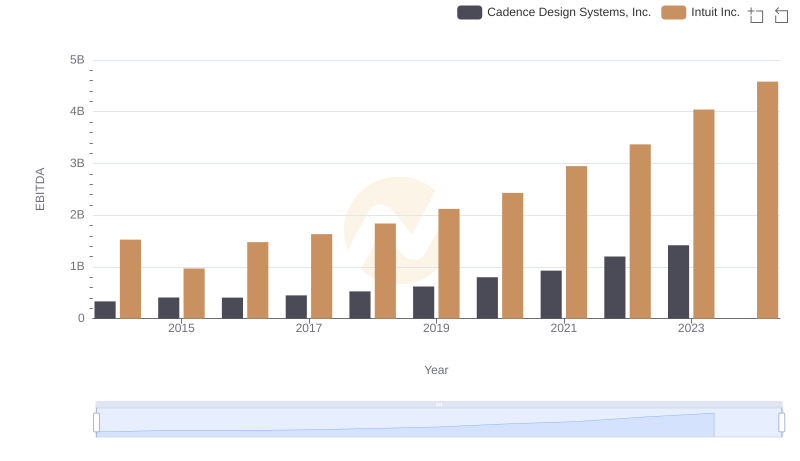
Comparative EBITDA Analysis: Intuit Inc. vs Cadence Design Systems, Inc.
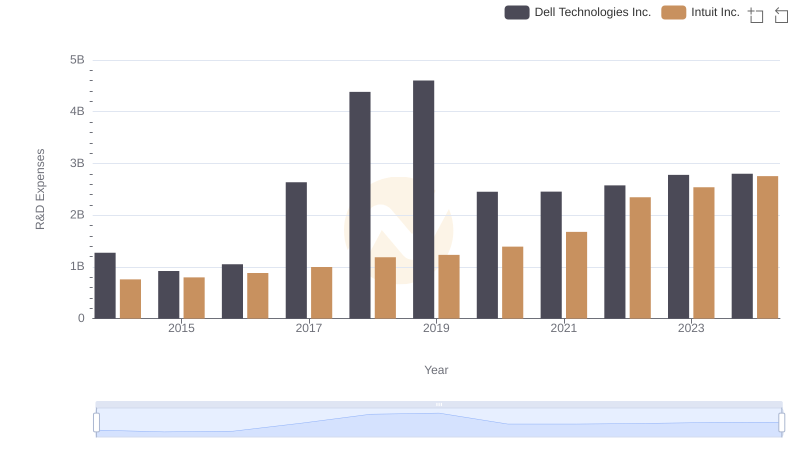
Intuit Inc. vs Dell Technologies Inc.: Strategic Focus on R&D Spending
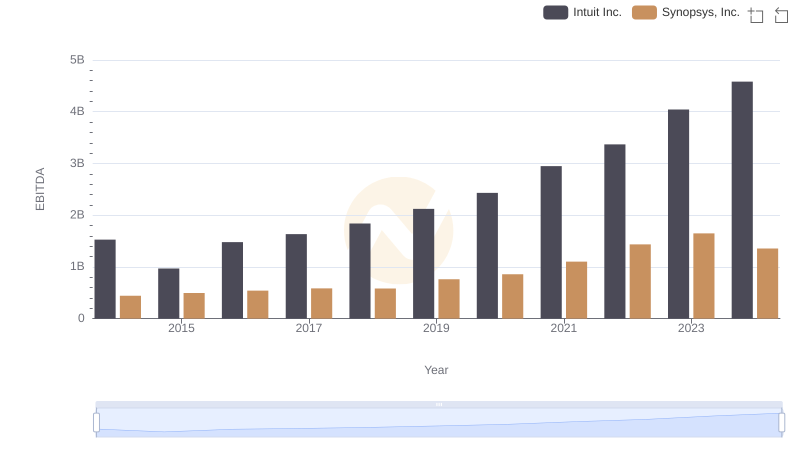
EBITDA Analysis: Evaluating Intuit Inc. Against Synopsys, Inc.
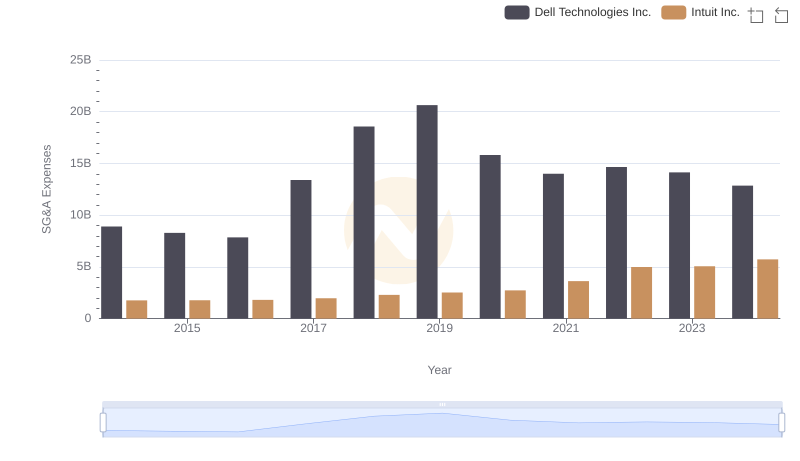
Operational Costs Compared: SG&A Analysis of Intuit Inc. and Dell Technologies Inc.
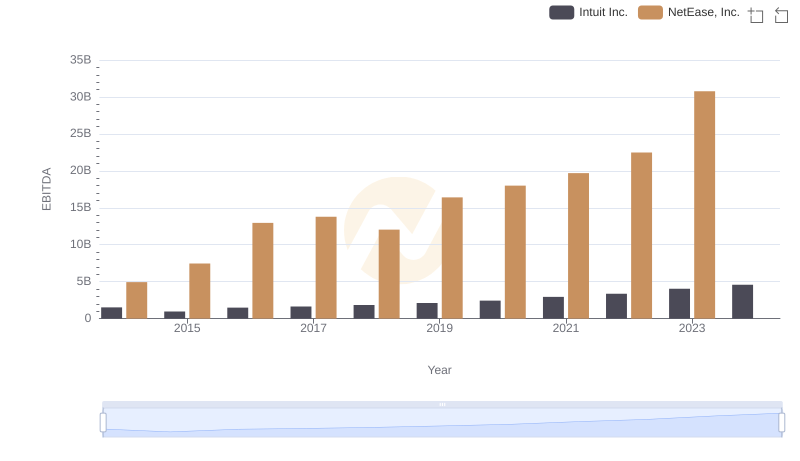
EBITDA Performance Review: Intuit Inc. vs NetEase, Inc.
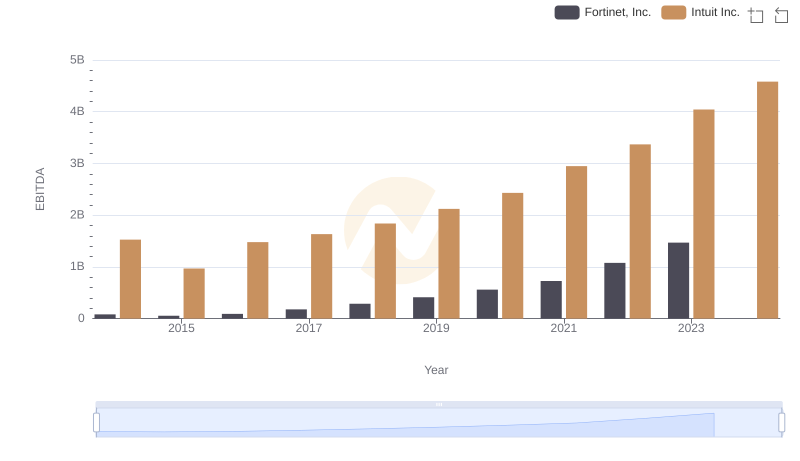
A Professional Review of EBITDA: Intuit Inc. Compared to Fortinet, Inc.
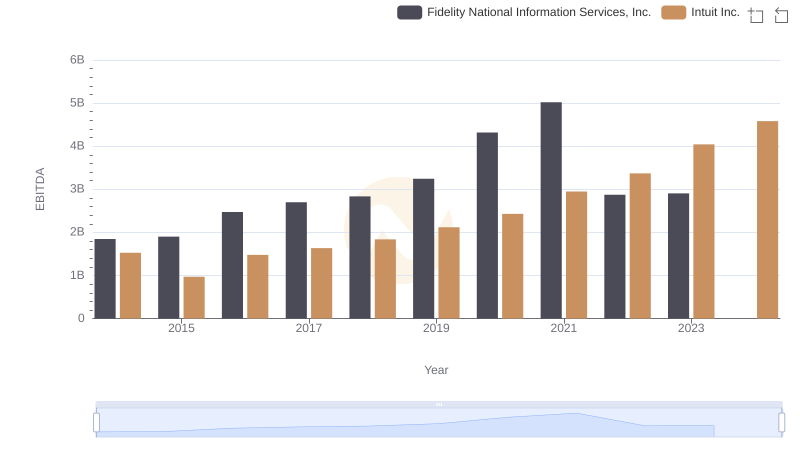
Comparative EBITDA Analysis: Intuit Inc. vs Fidelity National Information Services, Inc.
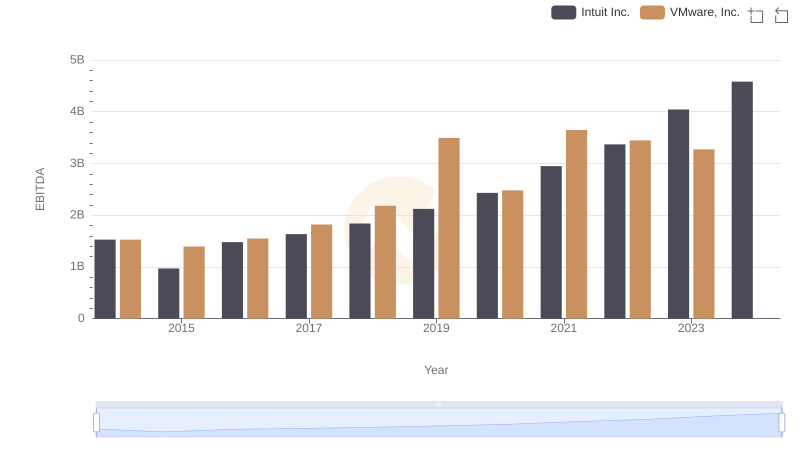
EBITDA Analysis: Evaluating Intuit Inc. Against VMware, Inc.
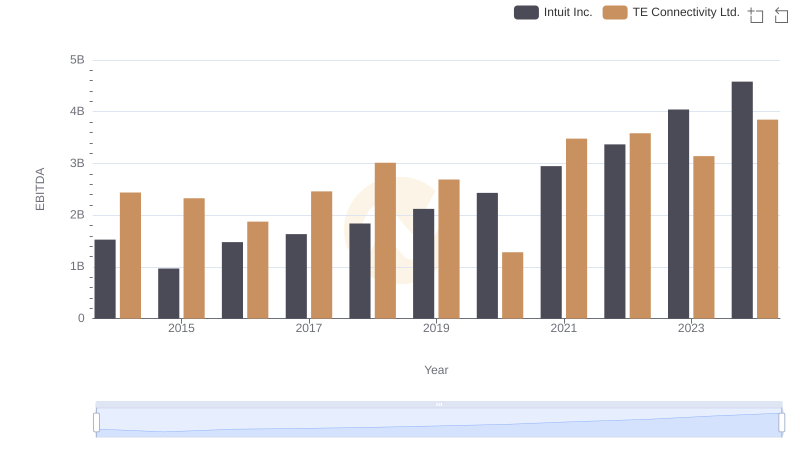
Intuit Inc. vs TE Connectivity Ltd.: In-Depth EBITDA Performance Comparison