| __timestamp | Cognizant Technology Solutions Corporation | Intuit Inc. |
|---|---|---|
| Wednesday, January 1, 2014 | 2093000000 | 1528000000 |
| Thursday, January 1, 2015 | 2472000000 | 970000000 |
| Friday, January 1, 2016 | 2668000000 | 1480000000 |
| Sunday, January 1, 2017 | 3040000000 | 1634000000 |
| Monday, January 1, 2018 | 3322000000 | 1839000000 |
| Tuesday, January 1, 2019 | 3095000000 | 2121000000 |
| Wednesday, January 1, 2020 | 2679000000 | 2430000000 |
| Friday, January 1, 2021 | 3410000000 | 2948000000 |
| Saturday, January 1, 2022 | 3604000000 | 3369000000 |
| Sunday, January 1, 2023 | 3347000000 | 4043000000 |
| Monday, January 1, 2024 | 3534000000 | 4581000000 |
Unveiling the hidden dimensions of data
In the ever-evolving landscape of technology, financial performance is a key indicator of a company's resilience and growth. This comparative analysis of EBITDA (Earnings Before Interest, Taxes, Depreciation, and Amortization) from 2014 to 2023 offers a fascinating glimpse into the financial journeys of Intuit Inc. and Cognizant Technology Solutions Corporation.
Intuit Inc. has demonstrated a remarkable upward trajectory, with its EBITDA growing by approximately 165% over the decade. Notably, in 2023, Intuit's EBITDA surged to over 4 billion, marking a significant milestone in its financial history.
Cognizant, while maintaining a steady growth, saw its EBITDA increase by around 60% during the same period. The peak was observed in 2022, with a slight dip in 2023, highlighting potential challenges or strategic shifts.
This analysis underscores the dynamic nature of the tech industry, where strategic decisions and market conditions can significantly impact financial outcomes.
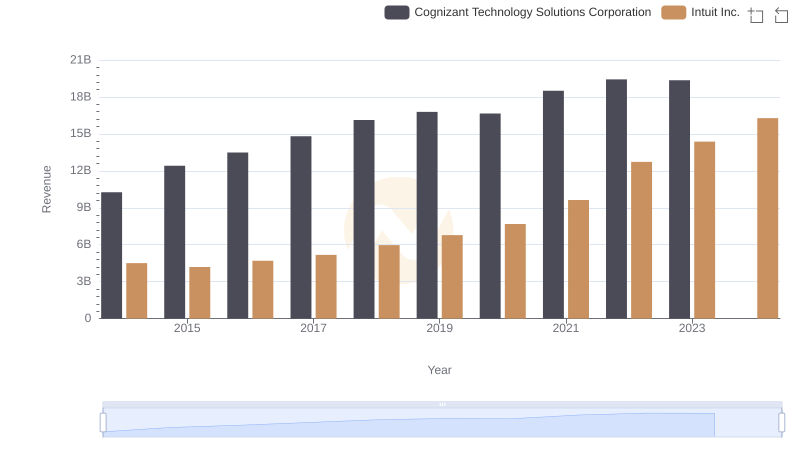
Revenue Insights: Intuit Inc. and Cognizant Technology Solutions Corporation Performance Compared
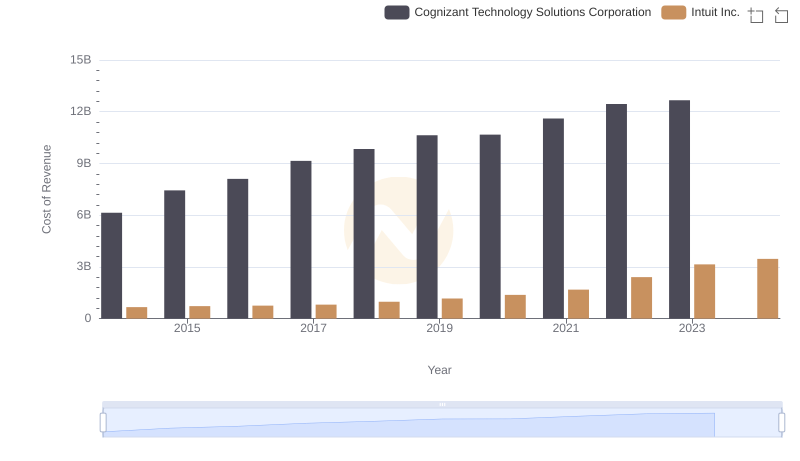
Cost Insights: Breaking Down Intuit Inc. and Cognizant Technology Solutions Corporation's Expenses
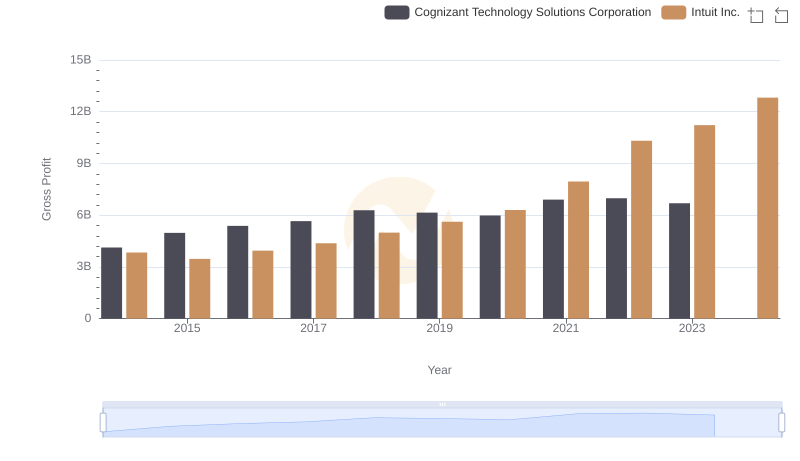
Gross Profit Analysis: Comparing Intuit Inc. and Cognizant Technology Solutions Corporation
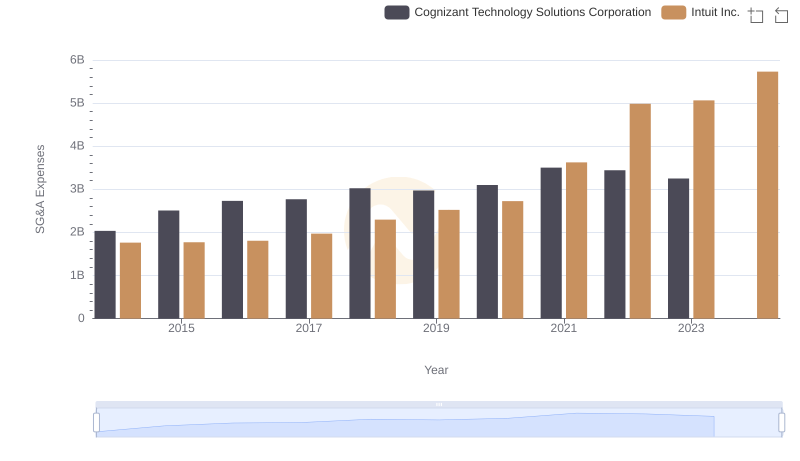
Cost Management Insights: SG&A Expenses for Intuit Inc. and Cognizant Technology Solutions Corporation
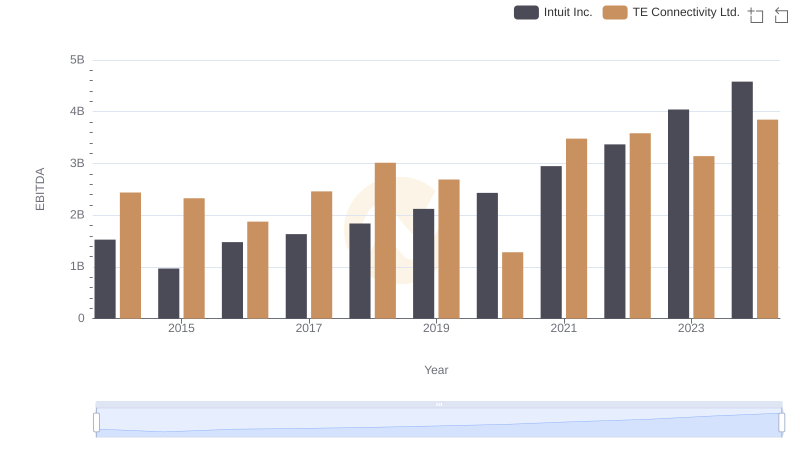
Intuit Inc. vs TE Connectivity Ltd.: In-Depth EBITDA Performance Comparison
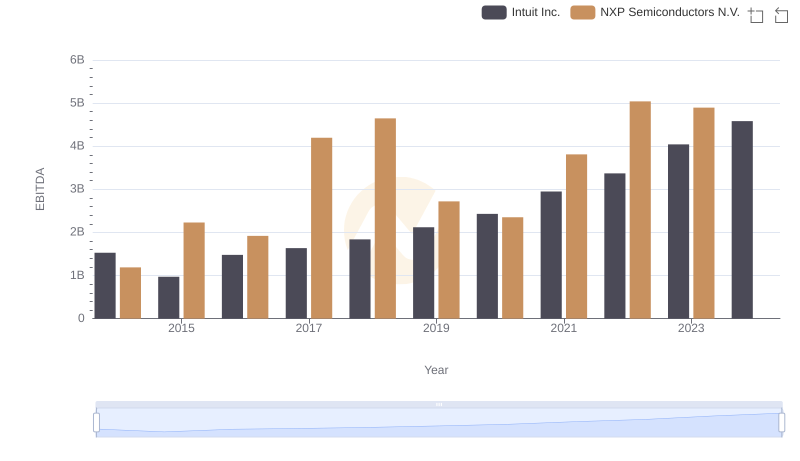
Professional EBITDA Benchmarking: Intuit Inc. vs NXP Semiconductors N.V.
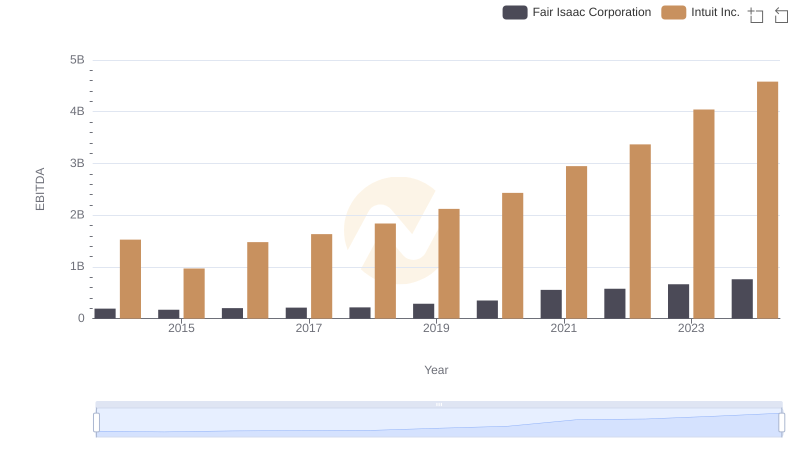
EBITDA Analysis: Evaluating Intuit Inc. Against Fair Isaac Corporation
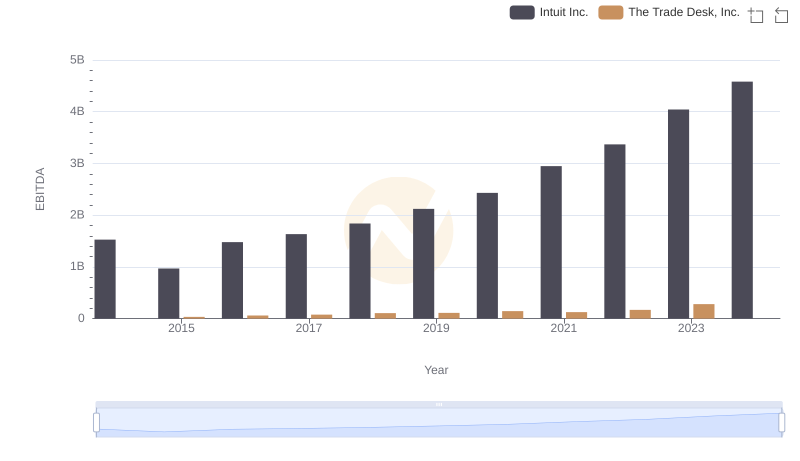
EBITDA Metrics Evaluated: Intuit Inc. vs The Trade Desk, Inc.
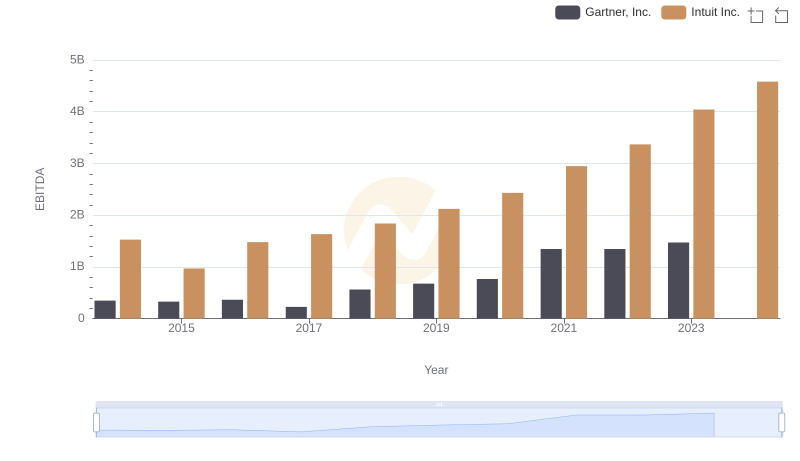
A Professional Review of EBITDA: Intuit Inc. Compared to Gartner, Inc.
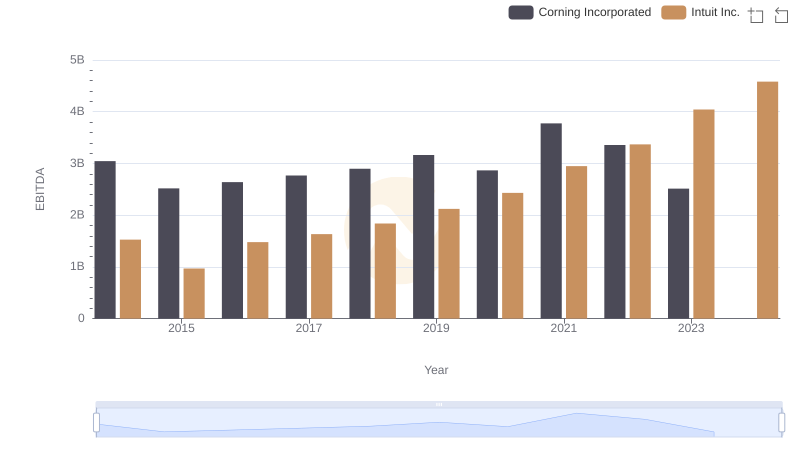
EBITDA Metrics Evaluated: Intuit Inc. vs Corning Incorporated
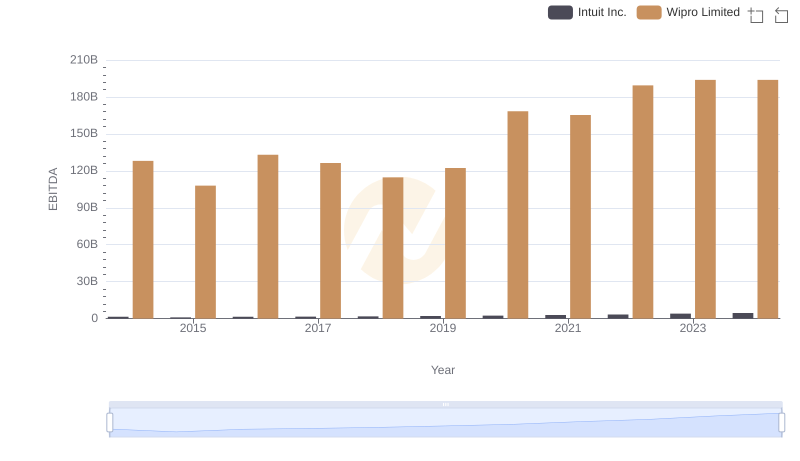
A Professional Review of EBITDA: Intuit Inc. Compared to Wipro Limited
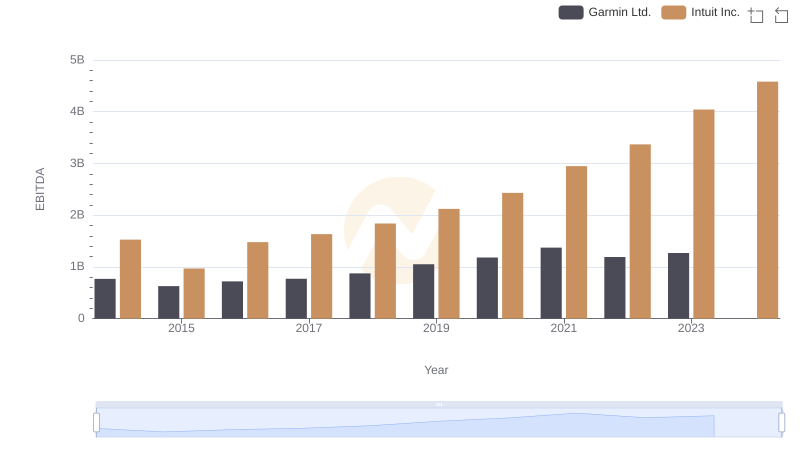
Intuit Inc. vs Garmin Ltd.: In-Depth EBITDA Performance Comparison