| __timestamp | Gartner, Inc. | Intuit Inc. |
|---|---|---|
| Wednesday, January 1, 2014 | 347441000 | 1528000000 |
| Thursday, January 1, 2015 | 328373000 | 970000000 |
| Friday, January 1, 2016 | 365793000 | 1480000000 |
| Sunday, January 1, 2017 | 227017000 | 1634000000 |
| Monday, January 1, 2018 | 563999000 | 1839000000 |
| Tuesday, January 1, 2019 | 677731000 | 2121000000 |
| Wednesday, January 1, 2020 | 765684000 | 2430000000 |
| Friday, January 1, 2021 | 1346852000 | 2948000000 |
| Saturday, January 1, 2022 | 1345344000 | 3369000000 |
| Sunday, January 1, 2023 | 1471004000 | 4043000000 |
| Monday, January 1, 2024 | 1720735000 | 4581000000 |
Unleashing insights
In the ever-evolving landscape of financial performance, EBITDA serves as a crucial metric for evaluating a company's operational efficiency. Over the past decade, Intuit Inc. has consistently outperformed Gartner, Inc. in terms of EBITDA growth. Starting in 2014, Intuit's EBITDA was approximately 4.5 times that of Gartner's. By 2023, Intuit's EBITDA had surged to nearly 4.0 billion, marking a remarkable 165% increase from 2014, while Gartner's EBITDA grew by 323% to reach 1.47 billion.
This trend highlights Intuit's robust financial health and strategic prowess in the tech industry. Despite Gartner's impressive growth, Intuit's ability to maintain a significant lead underscores its dominance. However, the data for 2024 is incomplete, leaving room for speculation on future trajectories. As we look ahead, these insights provide a compelling narrative of competitive dynamics in the tech sector.
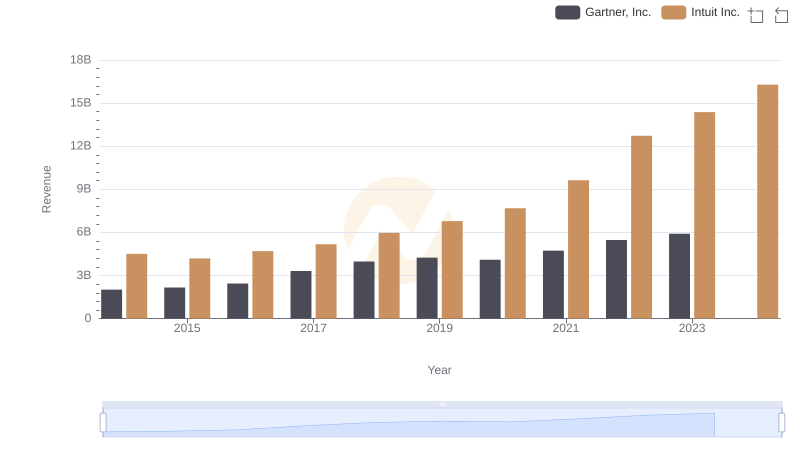
Intuit Inc. and Gartner, Inc.: A Comprehensive Revenue Analysis
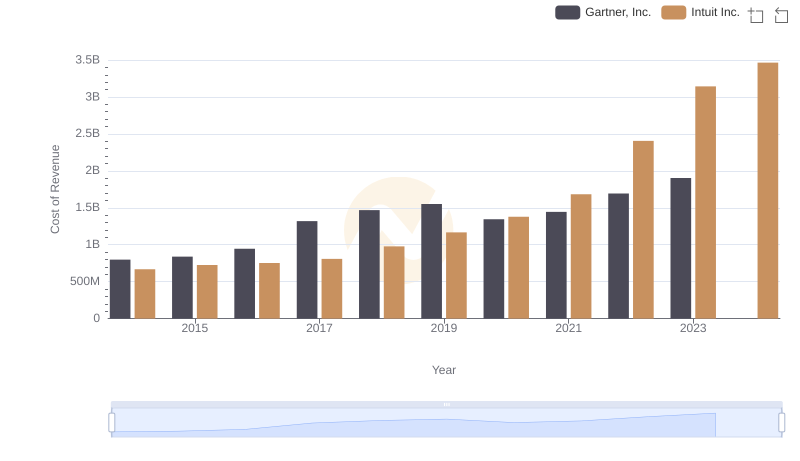
Intuit Inc. vs Gartner, Inc.: Efficiency in Cost of Revenue Explored
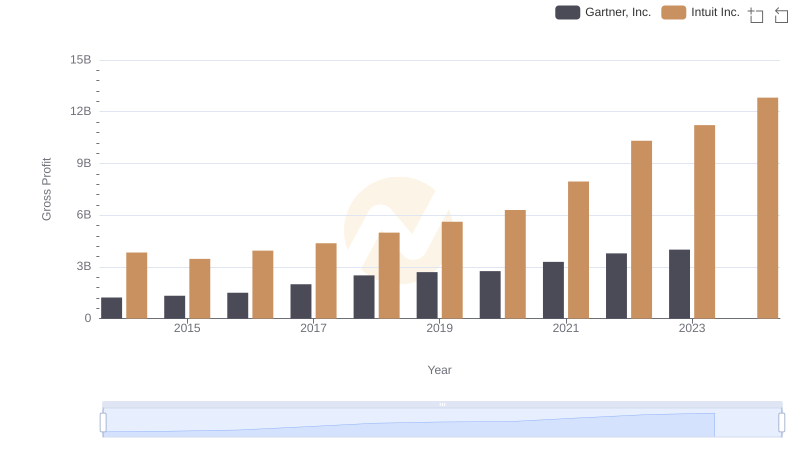
Who Generates Higher Gross Profit? Intuit Inc. or Gartner, Inc.
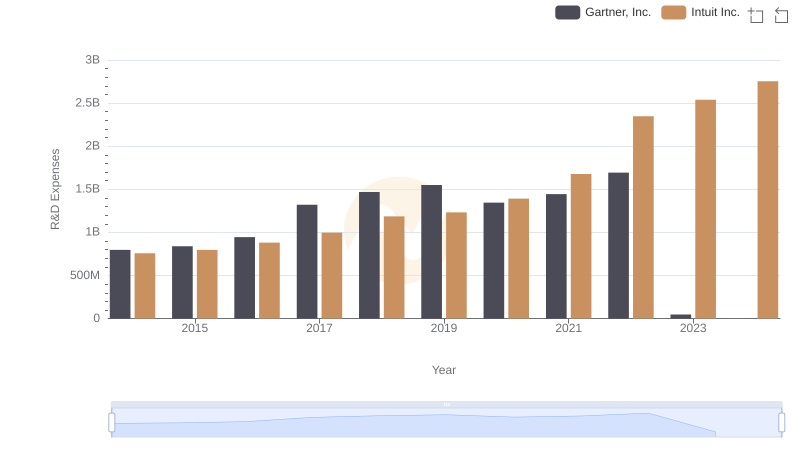
Intuit Inc. vs Gartner, Inc.: Strategic Focus on R&D Spending
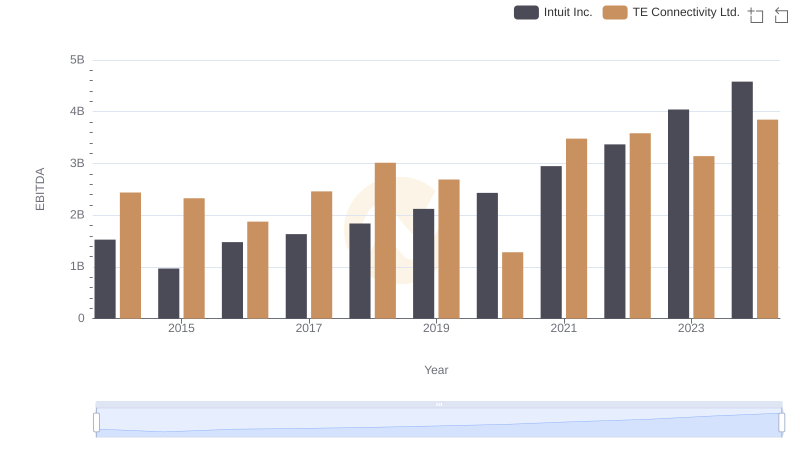
Intuit Inc. vs TE Connectivity Ltd.: In-Depth EBITDA Performance Comparison
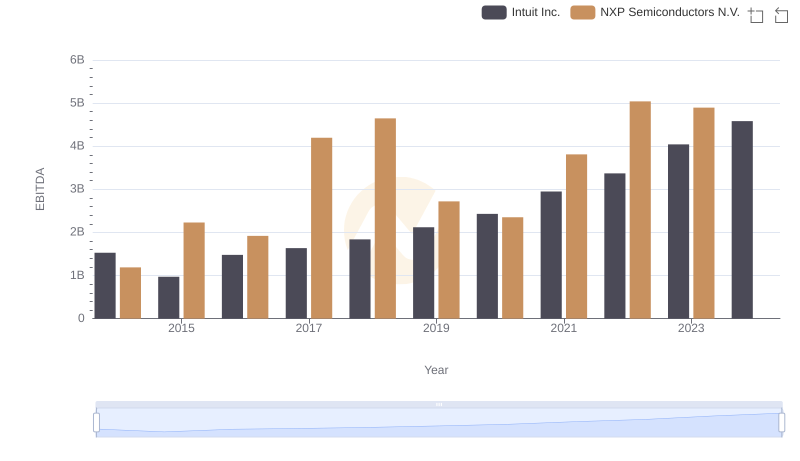
Professional EBITDA Benchmarking: Intuit Inc. vs NXP Semiconductors N.V.
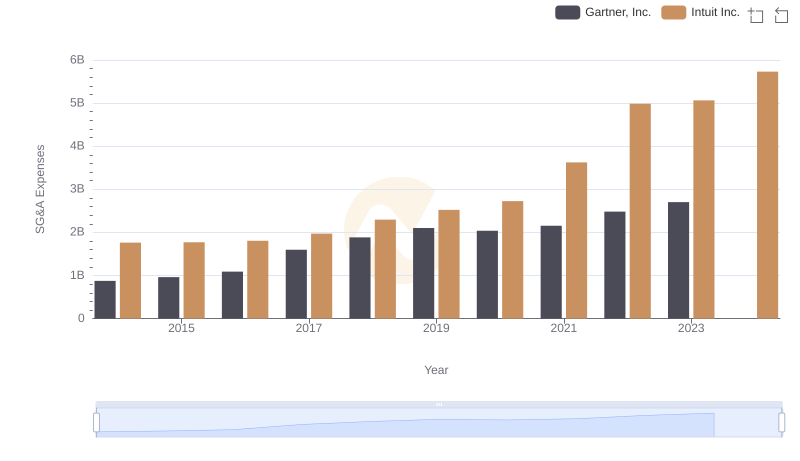
Intuit Inc. vs Gartner, Inc.: SG&A Expense Trends
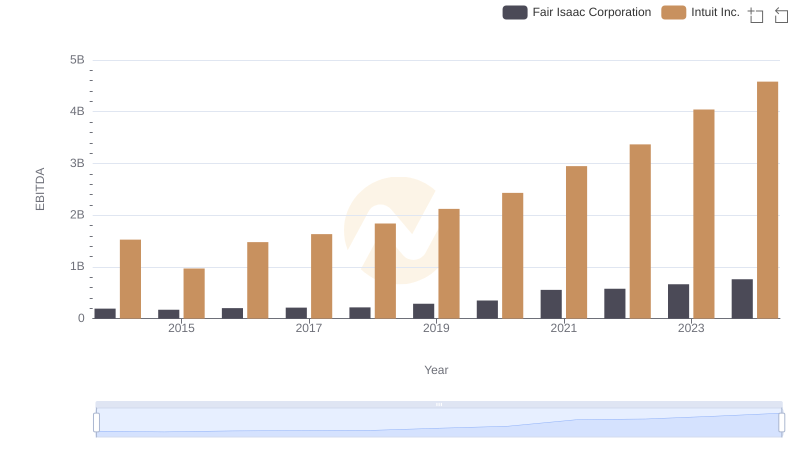
EBITDA Analysis: Evaluating Intuit Inc. Against Fair Isaac Corporation
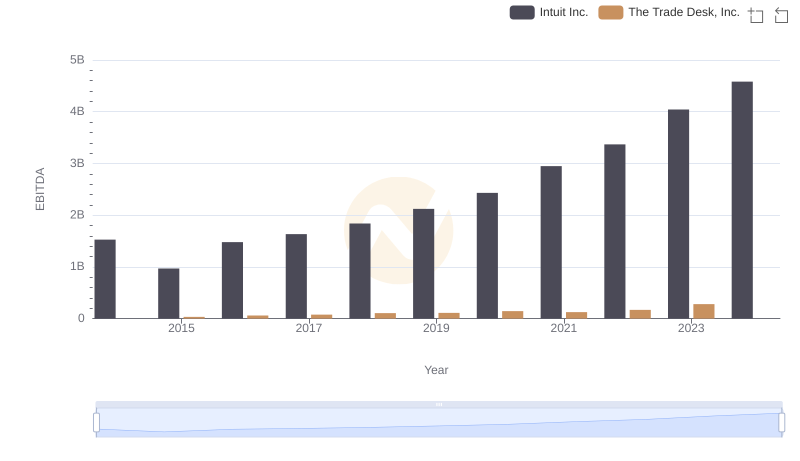
EBITDA Metrics Evaluated: Intuit Inc. vs The Trade Desk, Inc.
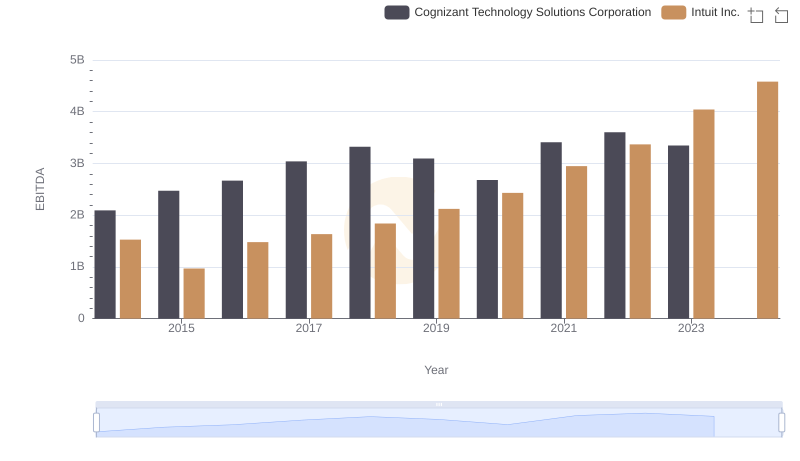
Comparative EBITDA Analysis: Intuit Inc. vs Cognizant Technology Solutions Corporation
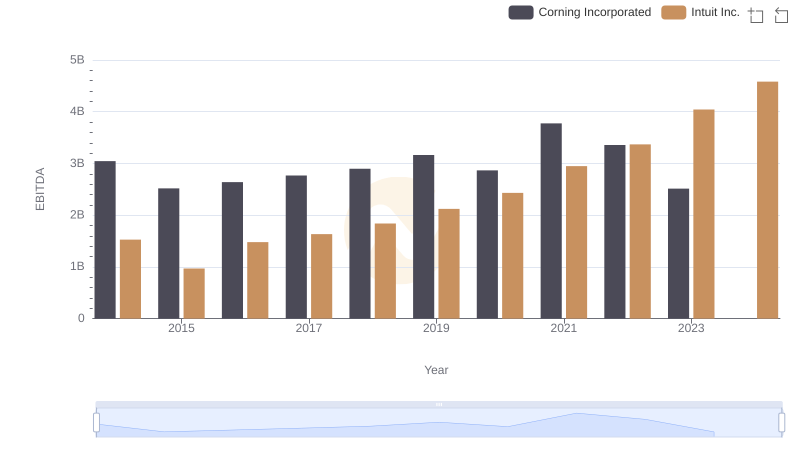
EBITDA Metrics Evaluated: Intuit Inc. vs Corning Incorporated
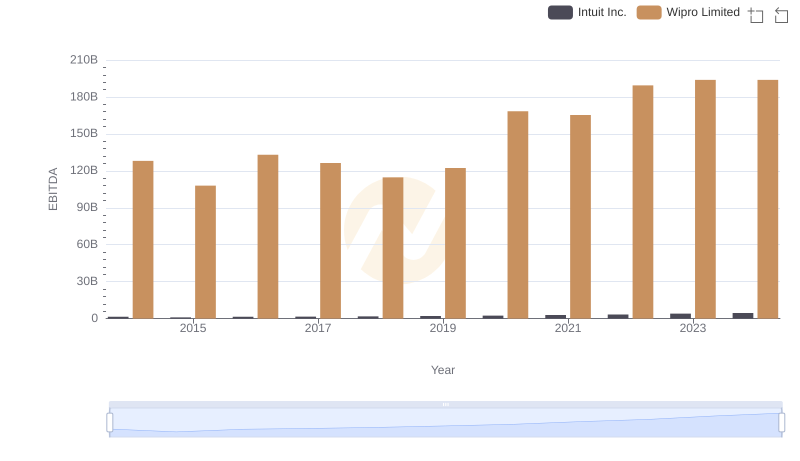
A Professional Review of EBITDA: Intuit Inc. Compared to Wipro Limited