| __timestamp | Intuit Inc. | Wipro Limited |
|---|---|---|
| Wednesday, January 1, 2014 | 1528000000 | 128105000000 |
| Thursday, January 1, 2015 | 970000000 | 107958000000 |
| Friday, January 1, 2016 | 1480000000 | 133082000000 |
| Sunday, January 1, 2017 | 1634000000 | 126406000000 |
| Monday, January 1, 2018 | 1839000000 | 114648000000 |
| Tuesday, January 1, 2019 | 2121000000 | 122279000000 |
| Wednesday, January 1, 2020 | 2430000000 | 168413000000 |
| Friday, January 1, 2021 | 2948000000 | 165303000000 |
| Saturday, January 1, 2022 | 3369000000 | 189377000000 |
| Sunday, January 1, 2023 | 4043000000 | 193833000000 |
| Monday, January 1, 2024 | 4581000000 | 193833000000 |
Cracking the code
In the ever-evolving landscape of global business, understanding the financial health of companies is crucial. This analysis delves into the EBITDA performance of two industry giants: Intuit Inc. and Wipro Limited, from 2014 to 2024. Over this decade, Intuit Inc. has shown a remarkable growth trajectory, with its EBITDA increasing by approximately 200%, from $1.5 billion in 2014 to an impressive $4.6 billion in 2024. This growth reflects Intuit's strategic focus on innovation and customer-centric solutions.
Conversely, Wipro Limited, a leader in the IT services sector, has maintained a steady EBITDA, hovering around $190 billion in recent years. Despite the challenges of a dynamic market, Wipro's consistent performance underscores its resilience and adaptability. This comparative analysis highlights the diverse strategies and market positions of these two companies, offering valuable insights for investors and industry analysts alike.
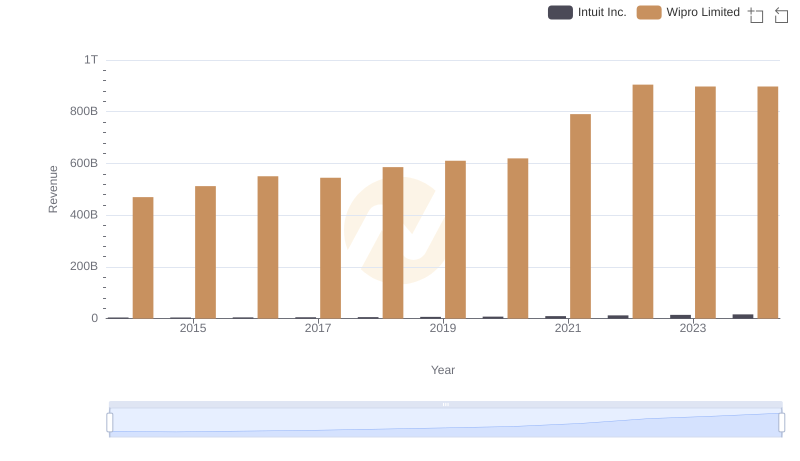
Intuit Inc. or Wipro Limited: Who Leads in Yearly Revenue?
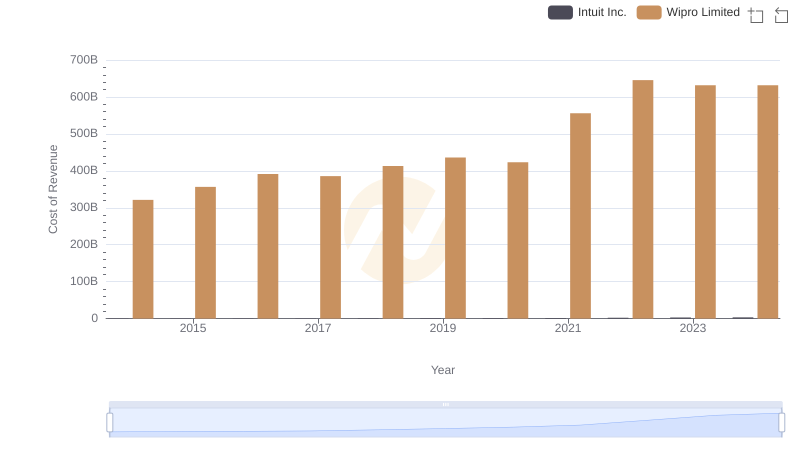
Cost of Revenue: Key Insights for Intuit Inc. and Wipro Limited
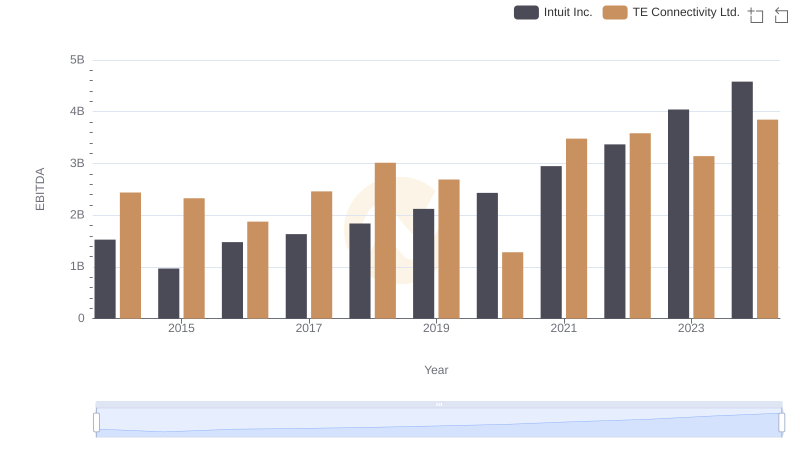
Intuit Inc. vs TE Connectivity Ltd.: In-Depth EBITDA Performance Comparison
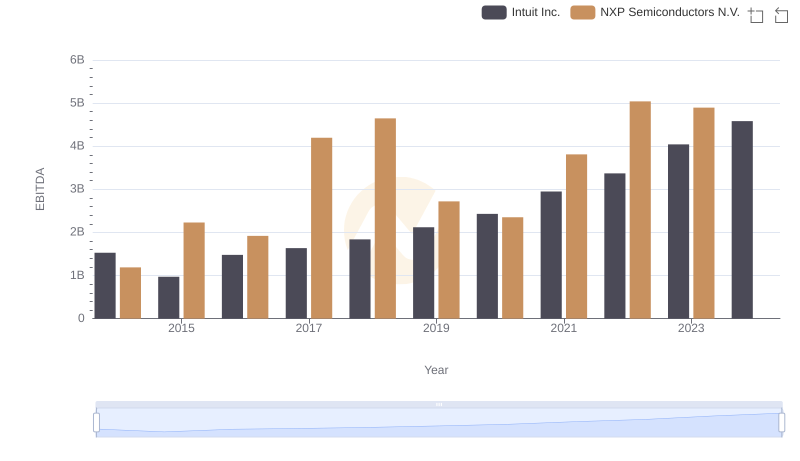
Professional EBITDA Benchmarking: Intuit Inc. vs NXP Semiconductors N.V.
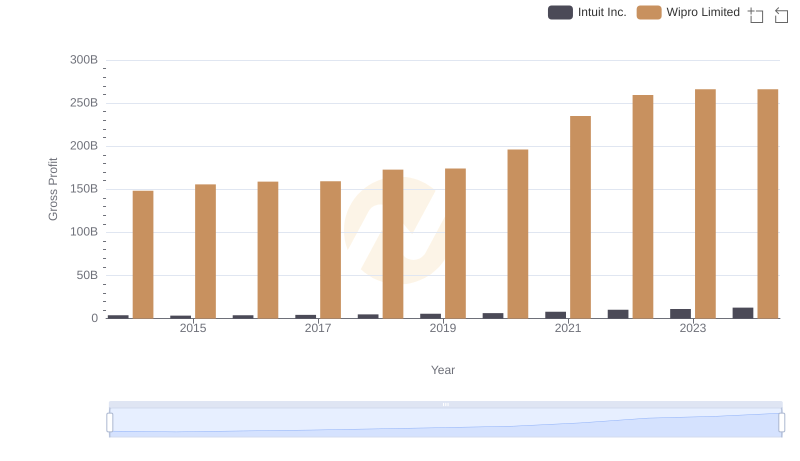
Gross Profit Trends Compared: Intuit Inc. vs Wipro Limited
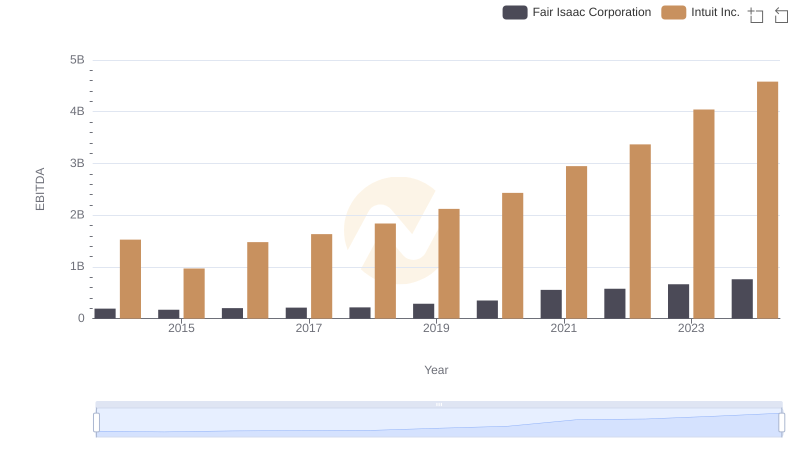
EBITDA Analysis: Evaluating Intuit Inc. Against Fair Isaac Corporation
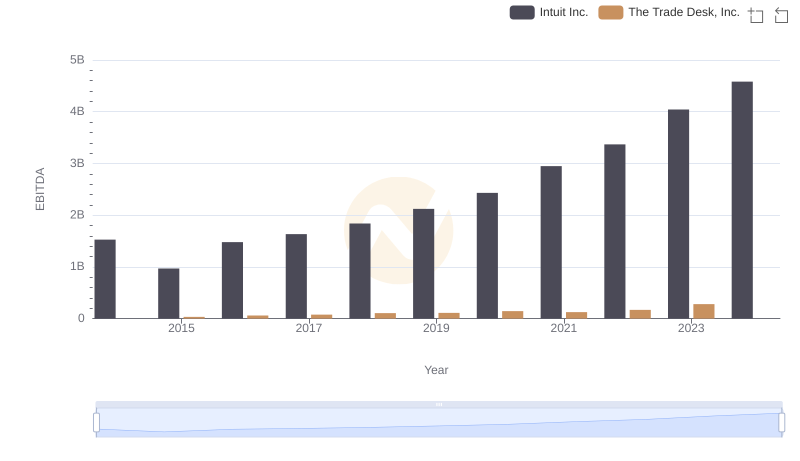
EBITDA Metrics Evaluated: Intuit Inc. vs The Trade Desk, Inc.
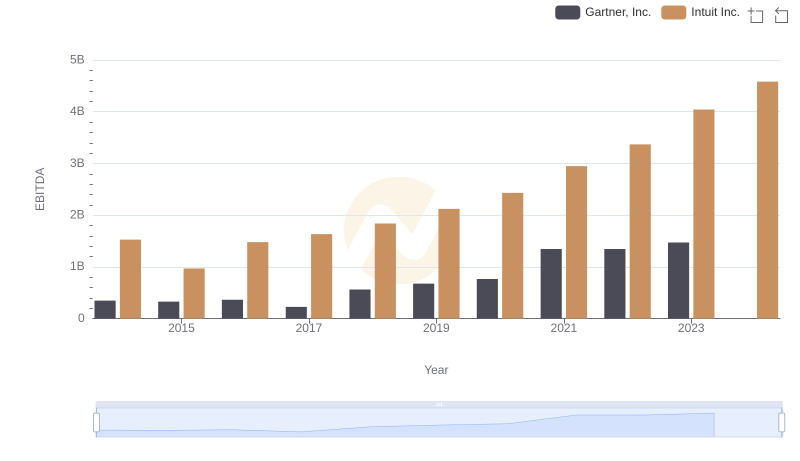
A Professional Review of EBITDA: Intuit Inc. Compared to Gartner, Inc.
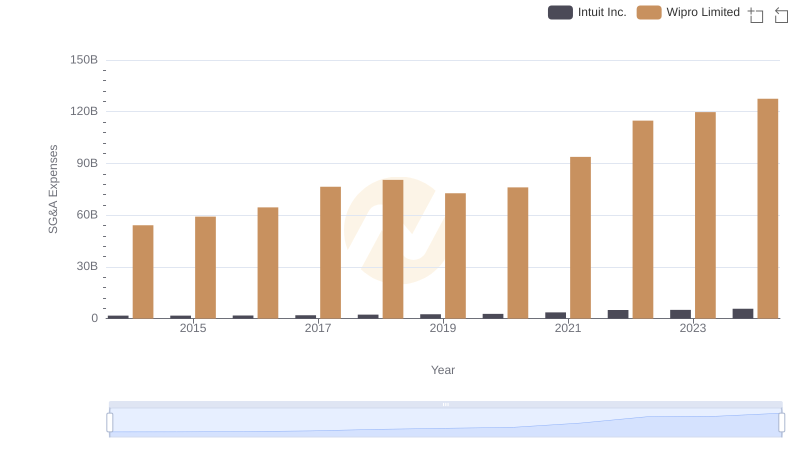
Breaking Down SG&A Expenses: Intuit Inc. vs Wipro Limited
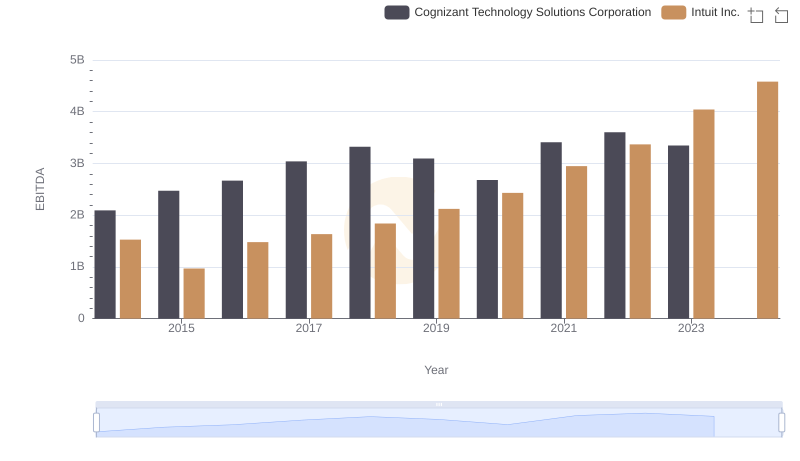
Comparative EBITDA Analysis: Intuit Inc. vs Cognizant Technology Solutions Corporation
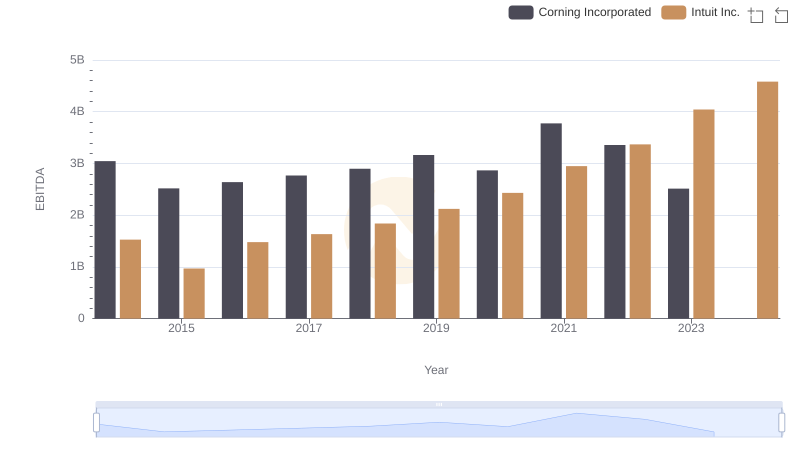
EBITDA Metrics Evaluated: Intuit Inc. vs Corning Incorporated
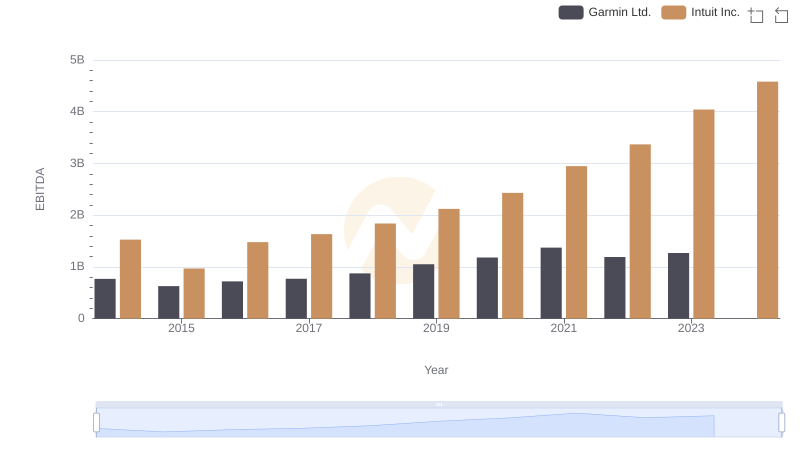
Intuit Inc. vs Garmin Ltd.: In-Depth EBITDA Performance Comparison