| __timestamp | Intuit Inc. | NXP Semiconductors N.V. |
|---|---|---|
| Wednesday, January 1, 2014 | 1528000000 | 1189000000 |
| Thursday, January 1, 2015 | 970000000 | 2230000000 |
| Friday, January 1, 2016 | 1480000000 | 1921000000 |
| Sunday, January 1, 2017 | 1634000000 | 4196000000 |
| Monday, January 1, 2018 | 1839000000 | 4645000000 |
| Tuesday, January 1, 2019 | 2121000000 | 2719000000 |
| Wednesday, January 1, 2020 | 2430000000 | 2351000000 |
| Friday, January 1, 2021 | 2948000000 | 3811000000 |
| Saturday, January 1, 2022 | 3369000000 | 5040000000 |
| Sunday, January 1, 2023 | 4043000000 | 4896000000 |
| Monday, January 1, 2024 | 4581000000 |
Unleashing the power of data
In the ever-evolving landscape of technology and finance, Intuit Inc. and NXP Semiconductors N.V. have emerged as formidable players. Over the past decade, these companies have demonstrated remarkable growth in their EBITDA, a key indicator of financial health and operational efficiency.
From 2014 to 2023, Intuit Inc. has seen its EBITDA grow by approximately 200%, reflecting its strategic investments and market adaptability. Meanwhile, NXP Semiconductors N.V. experienced a staggering 310% increase in EBITDA from 2014 to 2022, showcasing its robust performance in the semiconductor industry.
Interestingly, while Intuit's EBITDA continued to rise in 2024, NXP's data for the same year remains unavailable, leaving room for speculation about its future trajectory. This comparison not only highlights the dynamic nature of these industries but also underscores the importance of strategic foresight in maintaining competitive advantage.
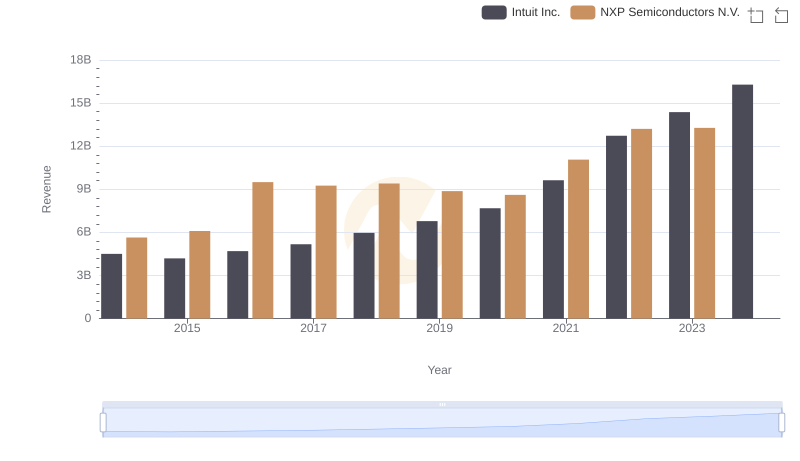
Intuit Inc. and NXP Semiconductors N.V.: A Comprehensive Revenue Analysis
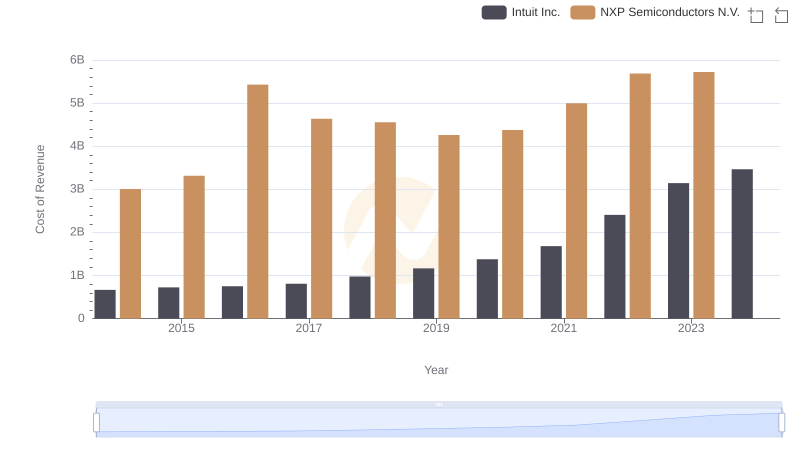
Comparing Cost of Revenue Efficiency: Intuit Inc. vs NXP Semiconductors N.V.
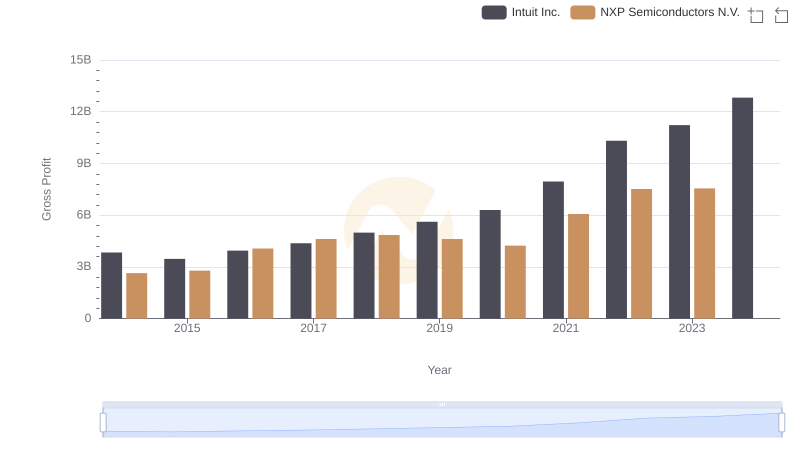
Gross Profit Trends Compared: Intuit Inc. vs NXP Semiconductors N.V.
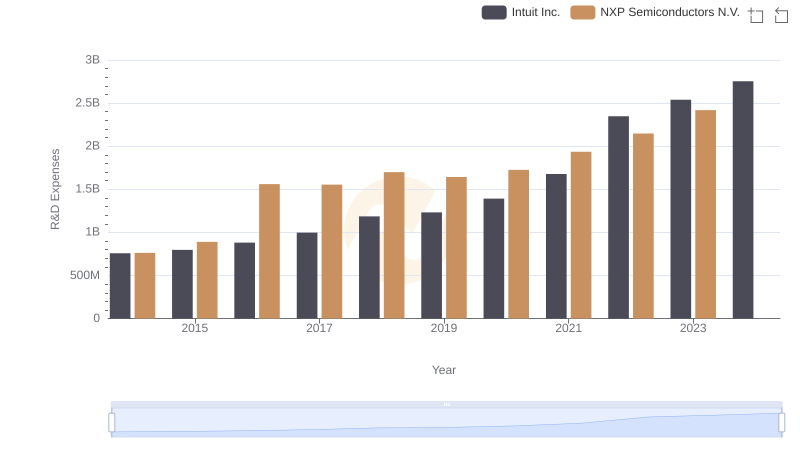
Who Prioritizes Innovation? R&D Spending Compared for Intuit Inc. and NXP Semiconductors N.V.
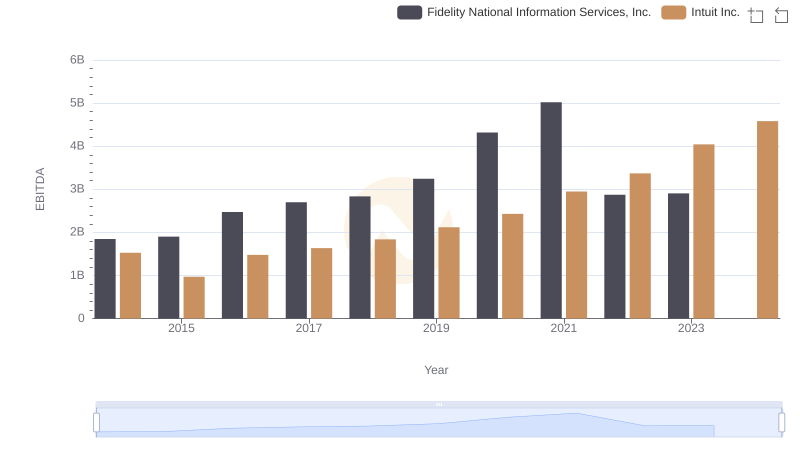
Comparative EBITDA Analysis: Intuit Inc. vs Fidelity National Information Services, Inc.
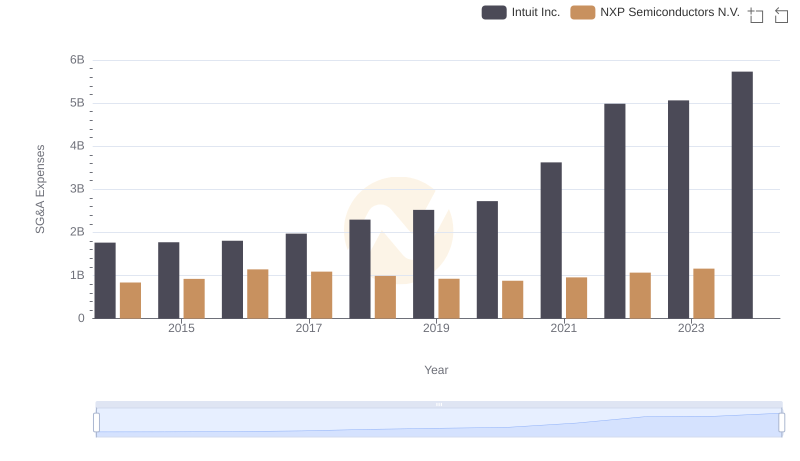
Cost Management Insights: SG&A Expenses for Intuit Inc. and NXP Semiconductors N.V.
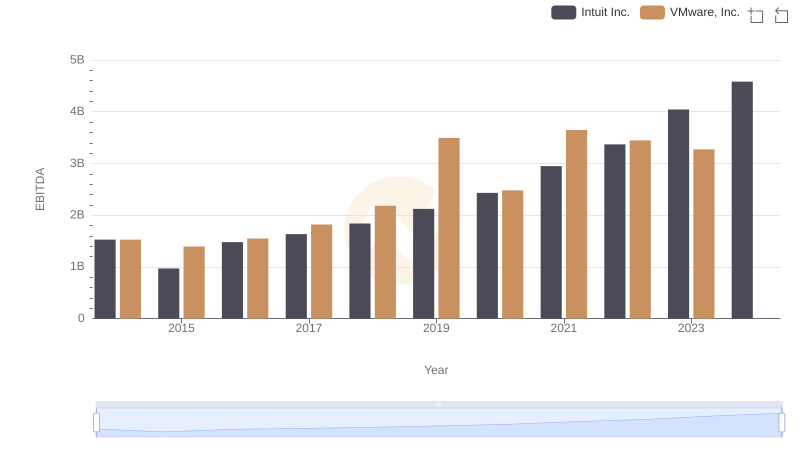
EBITDA Analysis: Evaluating Intuit Inc. Against VMware, Inc.
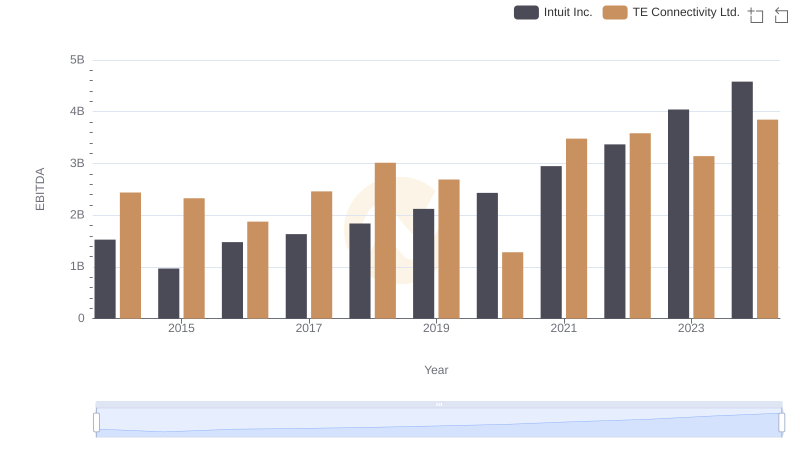
Intuit Inc. vs TE Connectivity Ltd.: In-Depth EBITDA Performance Comparison
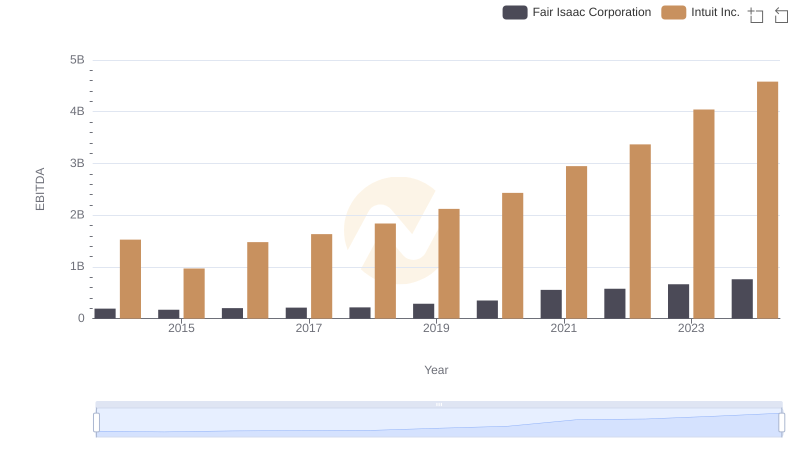
EBITDA Analysis: Evaluating Intuit Inc. Against Fair Isaac Corporation
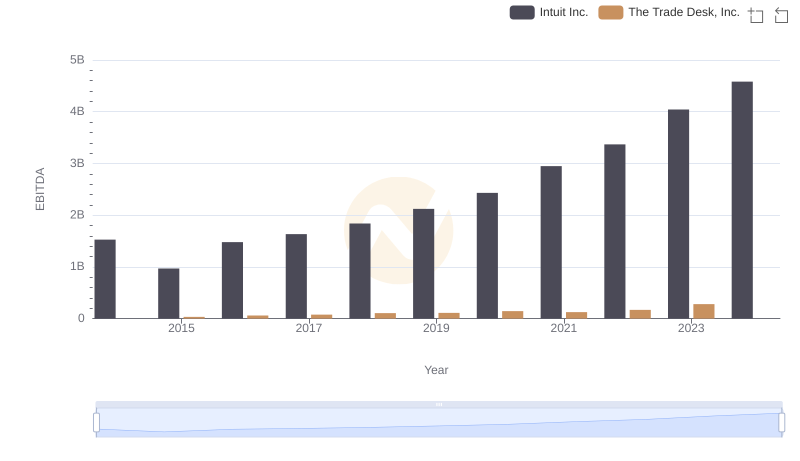
EBITDA Metrics Evaluated: Intuit Inc. vs The Trade Desk, Inc.
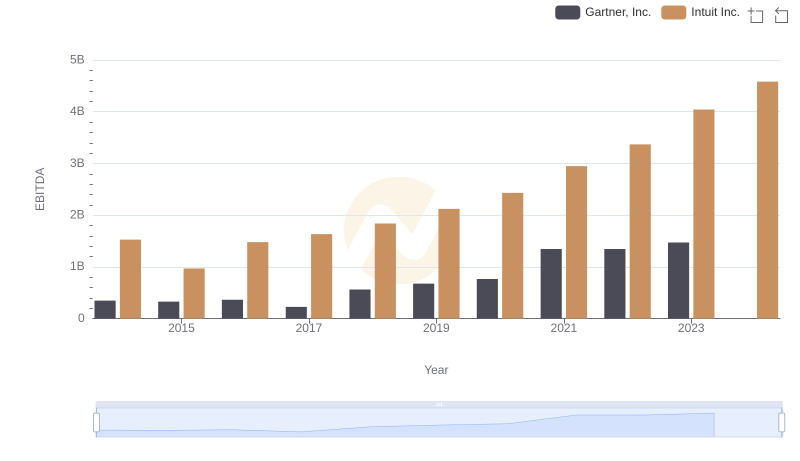
A Professional Review of EBITDA: Intuit Inc. Compared to Gartner, Inc.
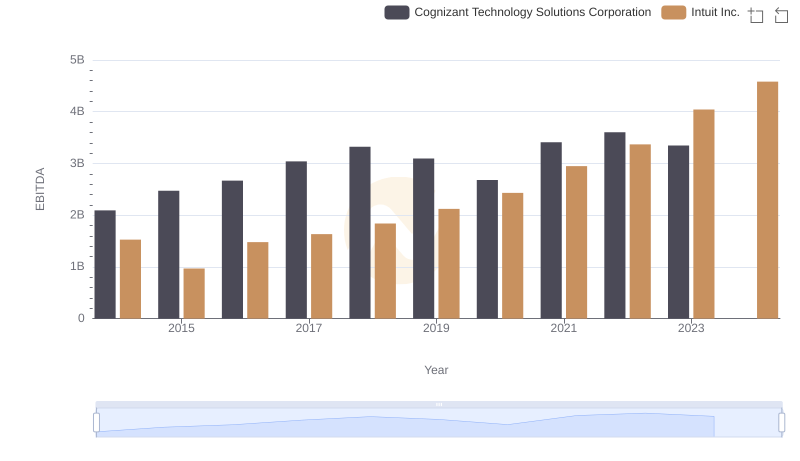
Comparative EBITDA Analysis: Intuit Inc. vs Cognizant Technology Solutions Corporation