| __timestamp | Hubbell Incorporated | United Rentals, Inc. |
|---|---|---|
| Wednesday, January 1, 2014 | 594700000 | 1678000000 |
| Thursday, January 1, 2015 | 533600000 | 2653000000 |
| Friday, January 1, 2016 | 564700000 | 2566000000 |
| Sunday, January 1, 2017 | 585600000 | 2843000000 |
| Monday, January 1, 2018 | 677500000 | 3628000000 |
| Tuesday, January 1, 2019 | 740900000 | 4200000000 |
| Wednesday, January 1, 2020 | 671400000 | 2195000000 |
| Friday, January 1, 2021 | 661000000 | 2642000000 |
| Saturday, January 1, 2022 | 854300000 | 5464000000 |
| Sunday, January 1, 2023 | 1169700000 | 6627000000 |
| Monday, January 1, 2024 | 1291200000 | 4516000000 |
Igniting the spark of knowledge
In the competitive landscape of industrial giants, United Rentals, Inc. and Hubbell Incorporated have showcased intriguing financial trajectories over the past decade. Since 2014, United Rentals has consistently outperformed Hubbell in terms of EBITDA, with a staggering 295% increase by 2023. This growth highlights United Rentals' strategic prowess in capitalizing on market opportunities. Meanwhile, Hubbell has demonstrated steady growth, achieving a 97% increase in EBITDA over the same period, peaking in 2023.
The year 2020 marked a challenging period for both companies, with United Rentals experiencing a significant dip, while Hubbell maintained relative stability. However, by 2022, United Rentals rebounded impressively, nearly doubling its EBITDA from 2020. As we look to the future, 2024 data remains incomplete, leaving room for speculation on how these industrial titans will navigate the evolving economic landscape.
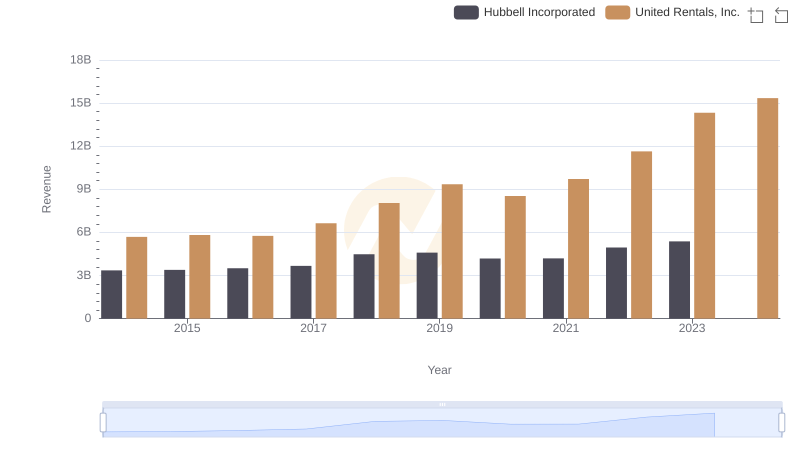
Revenue Showdown: United Rentals, Inc. vs Hubbell Incorporated
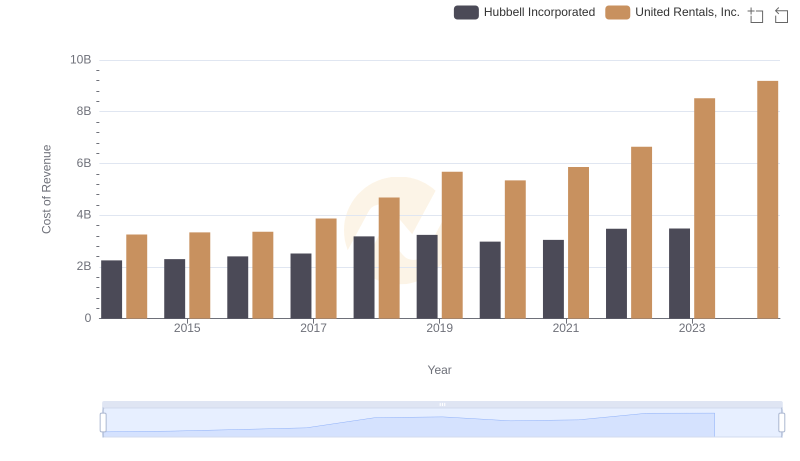
Comparing Cost of Revenue Efficiency: United Rentals, Inc. vs Hubbell Incorporated
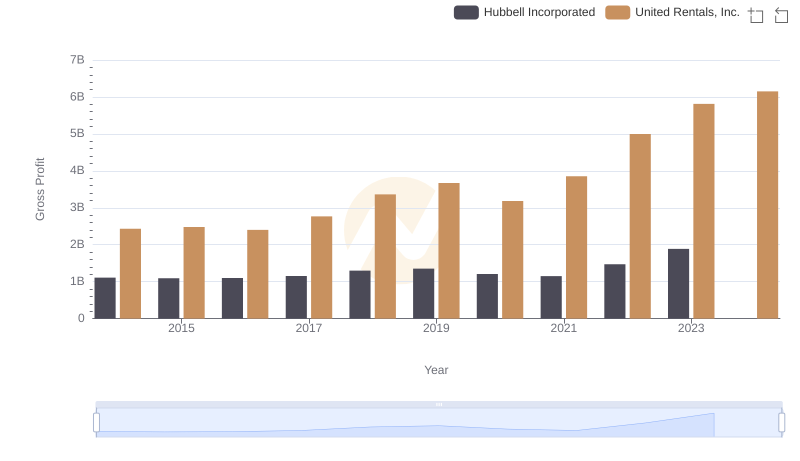
Who Generates Higher Gross Profit? United Rentals, Inc. or Hubbell Incorporated
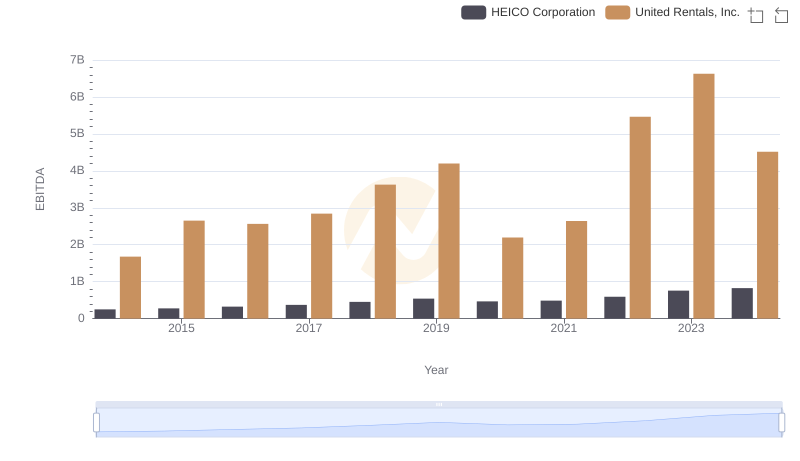
United Rentals, Inc. vs HEICO Corporation: In-Depth EBITDA Performance Comparison
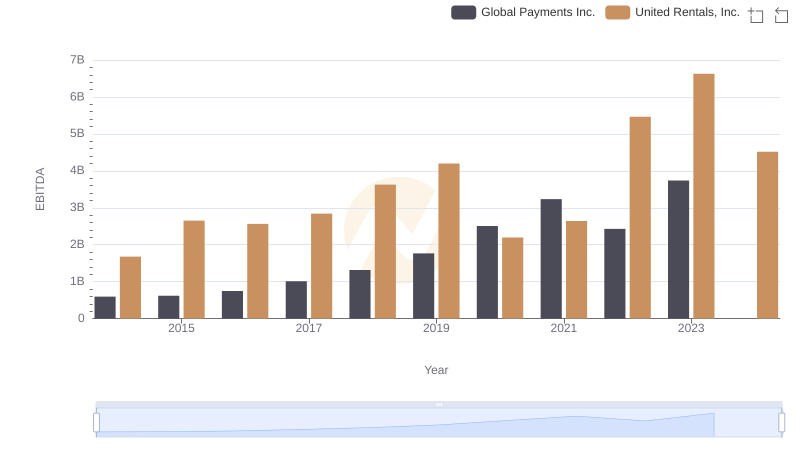
A Side-by-Side Analysis of EBITDA: United Rentals, Inc. and Global Payments Inc.
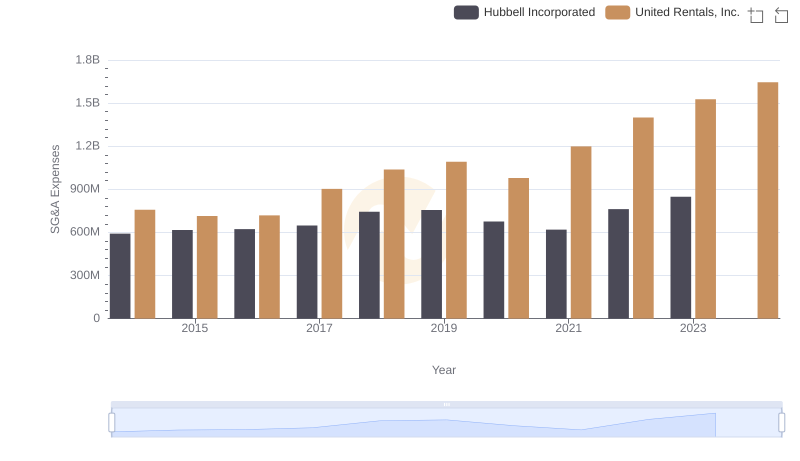
Who Optimizes SG&A Costs Better? United Rentals, Inc. or Hubbell Incorporated
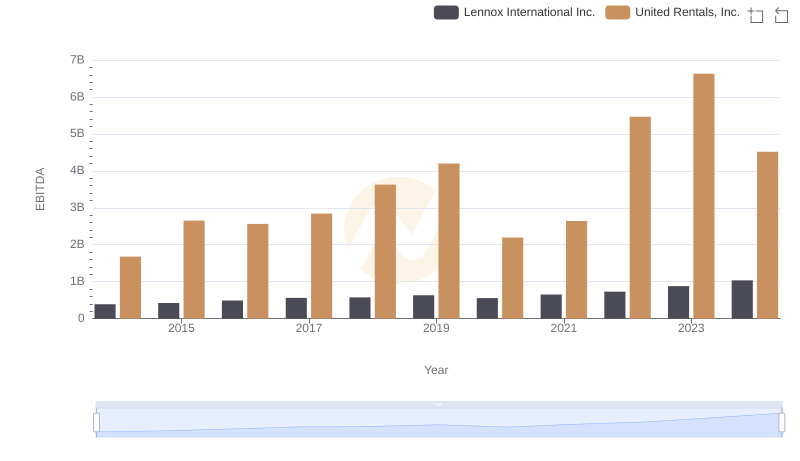
EBITDA Performance Review: United Rentals, Inc. vs Lennox International Inc.
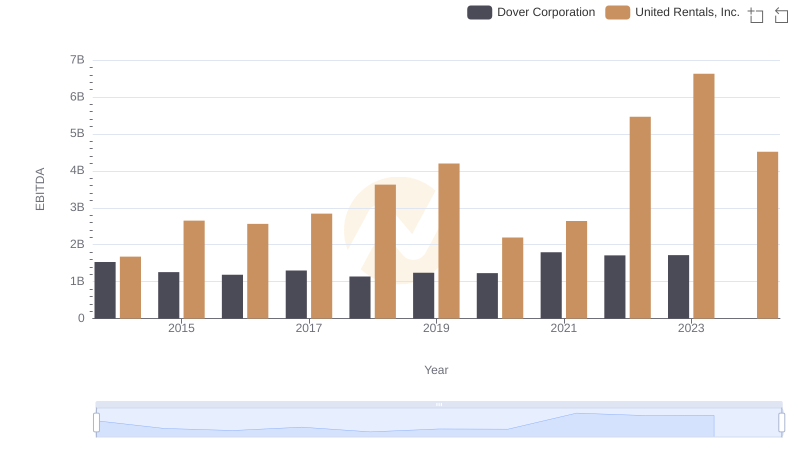
Comparative EBITDA Analysis: United Rentals, Inc. vs Dover Corporation

Comprehensive EBITDA Comparison: United Rentals, Inc. vs EMCOR Group, Inc.
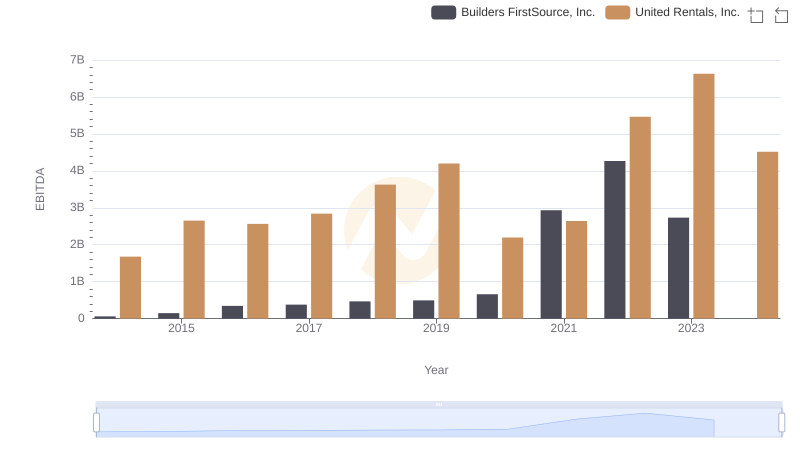
United Rentals, Inc. vs Builders FirstSource, Inc.: In-Depth EBITDA Performance Comparison
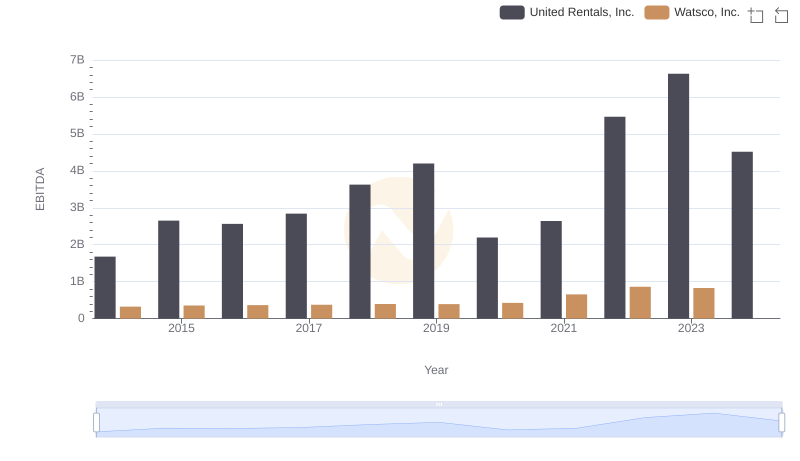
EBITDA Analysis: Evaluating United Rentals, Inc. Against Watsco, Inc.
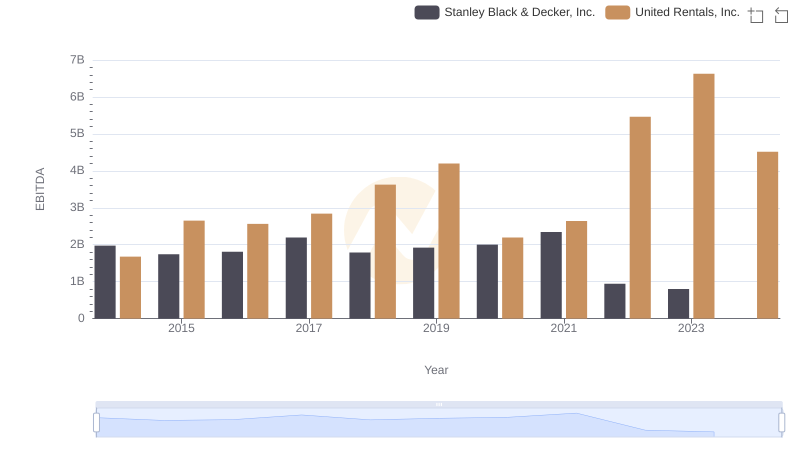
A Side-by-Side Analysis of EBITDA: United Rentals, Inc. and Stanley Black & Decker, Inc.