| __timestamp | Lennox International Inc. | United Rentals, Inc. |
|---|---|---|
| Wednesday, January 1, 2014 | 387700000 | 1678000000 |
| Thursday, January 1, 2015 | 423600000 | 2653000000 |
| Friday, January 1, 2016 | 490800000 | 2566000000 |
| Sunday, January 1, 2017 | 562900000 | 2843000000 |
| Monday, January 1, 2018 | 575200000 | 3628000000 |
| Tuesday, January 1, 2019 | 633300000 | 4200000000 |
| Wednesday, January 1, 2020 | 553900000 | 2195000000 |
| Friday, January 1, 2021 | 652500000 | 2642000000 |
| Saturday, January 1, 2022 | 729000000 | 5464000000 |
| Sunday, January 1, 2023 | 879500000 | 6627000000 |
| Monday, January 1, 2024 | 1034800000 | 4516000000 |
Infusing magic into the data realm
In the competitive landscape of industrial services and climate control solutions, United Rentals, Inc. and Lennox International Inc. have showcased distinct EBITDA trajectories over the past decade. From 2014 to 2023, United Rentals has consistently outperformed Lennox International, with its EBITDA peaking at approximately $6.6 billion in 2023, marking a staggering 295% increase from 2014. In contrast, Lennox International's EBITDA growth, while steady, reached around $1 billion in 2023, reflecting a 167% rise since 2014.
This divergence highlights United Rentals' robust expansion strategy and market adaptability, especially evident in the post-pandemic recovery phase. Meanwhile, Lennox International's steady climb underscores its resilience and focus on sustainable growth. As we look to 2024, these trends offer valuable insights into the strategic directions and market positions of these industry leaders.
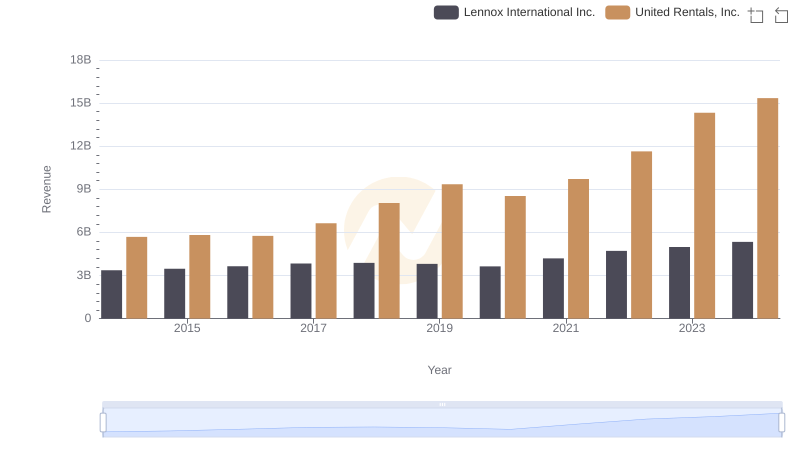
United Rentals, Inc. vs Lennox International Inc.: Annual Revenue Growth Compared
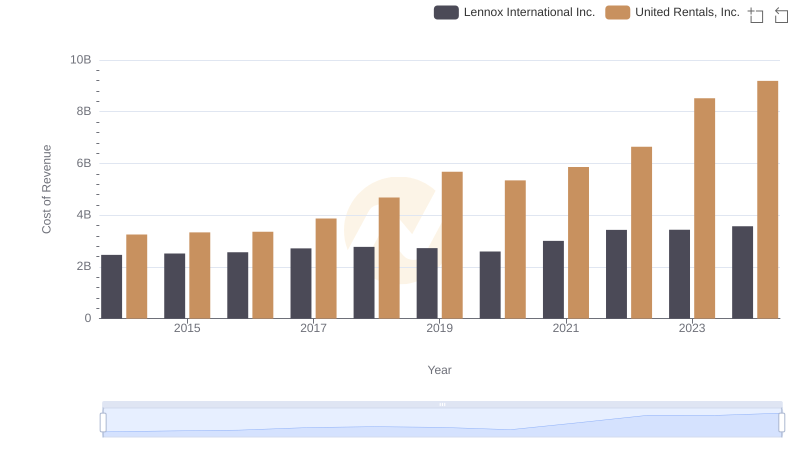
Cost of Revenue Trends: United Rentals, Inc. vs Lennox International Inc.
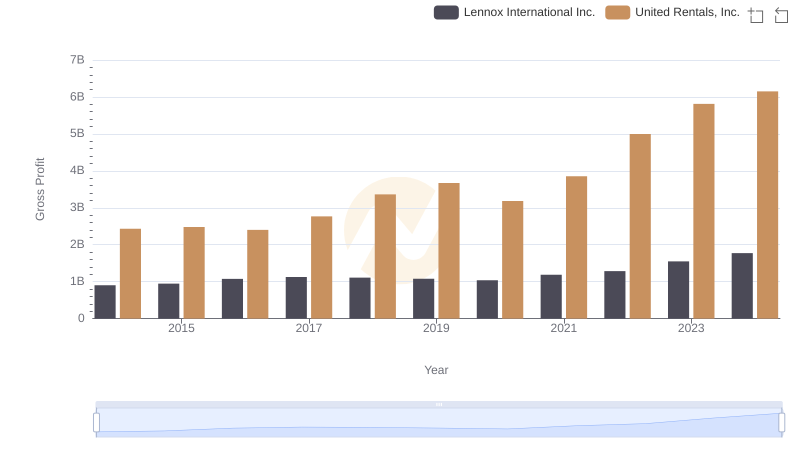
Gross Profit Comparison: United Rentals, Inc. and Lennox International Inc. Trends
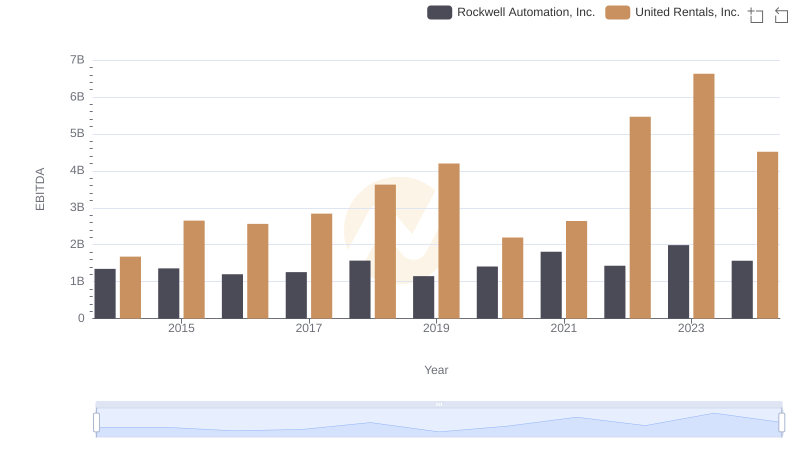
EBITDA Metrics Evaluated: United Rentals, Inc. vs Rockwell Automation, Inc.
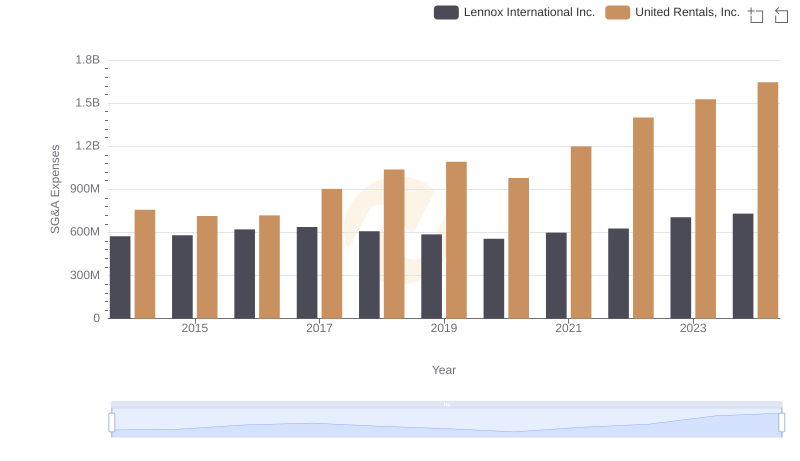
United Rentals, Inc. and Lennox International Inc.: SG&A Spending Patterns Compared
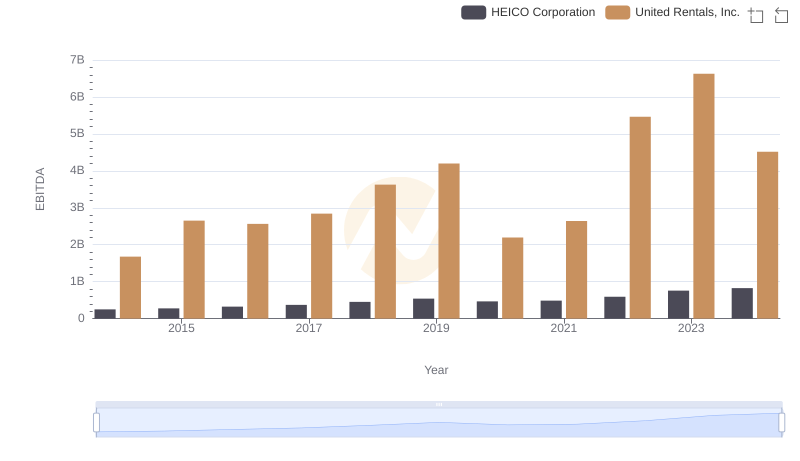
United Rentals, Inc. vs HEICO Corporation: In-Depth EBITDA Performance Comparison
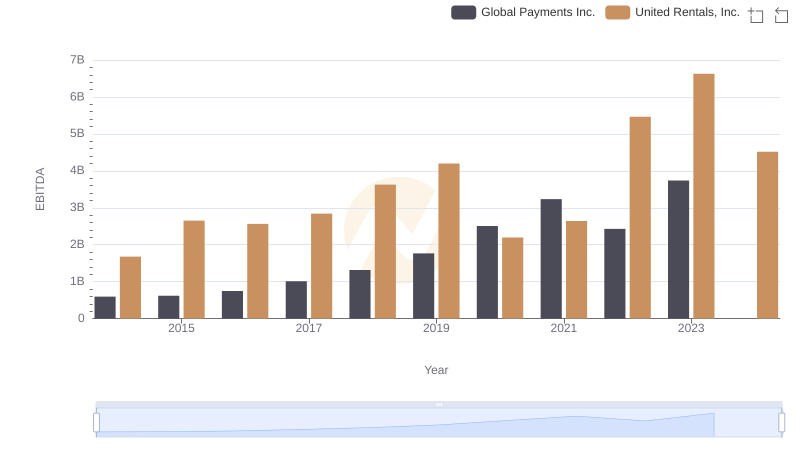
A Side-by-Side Analysis of EBITDA: United Rentals, Inc. and Global Payments Inc.
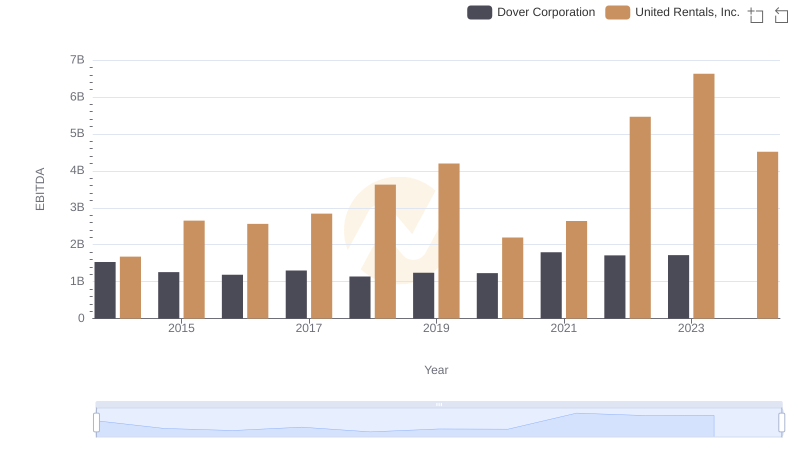
Comparative EBITDA Analysis: United Rentals, Inc. vs Dover Corporation
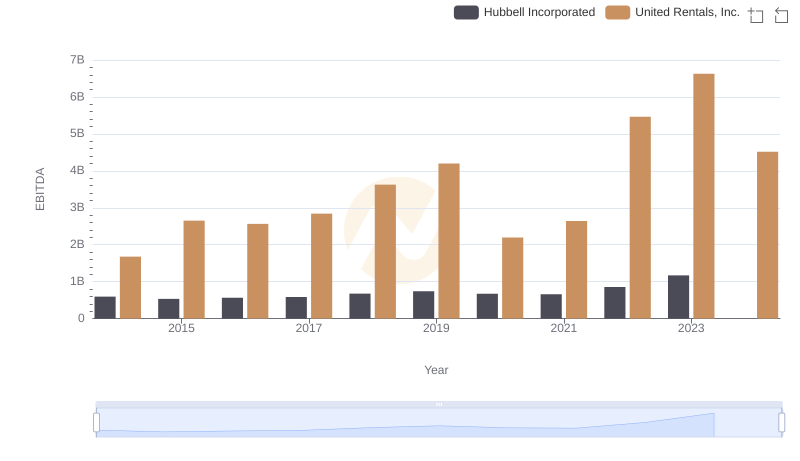
EBITDA Analysis: Evaluating United Rentals, Inc. Against Hubbell Incorporated

Comprehensive EBITDA Comparison: United Rentals, Inc. vs EMCOR Group, Inc.
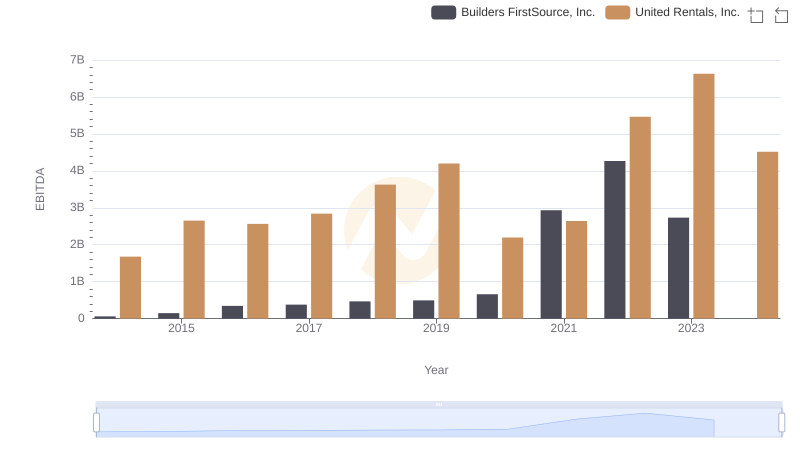
United Rentals, Inc. vs Builders FirstSource, Inc.: In-Depth EBITDA Performance Comparison
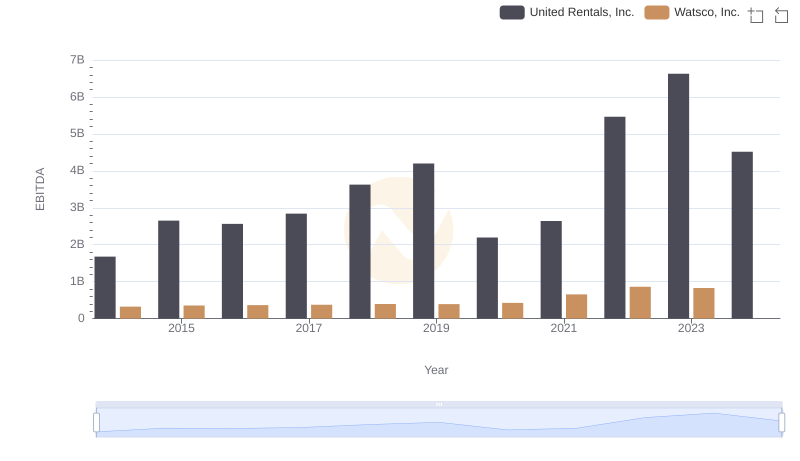
EBITDA Analysis: Evaluating United Rentals, Inc. Against Watsco, Inc.