| __timestamp | Hubbell Incorporated | United Rentals, Inc. |
|---|---|---|
| Wednesday, January 1, 2014 | 1109000000 | 2432000000 |
| Thursday, January 1, 2015 | 1091800000 | 2480000000 |
| Friday, January 1, 2016 | 1100700000 | 2403000000 |
| Sunday, January 1, 2017 | 1151900000 | 2769000000 |
| Monday, January 1, 2018 | 1300400000 | 3364000000 |
| Tuesday, January 1, 2019 | 1352700000 | 3670000000 |
| Wednesday, January 1, 2020 | 1209300000 | 3183000000 |
| Friday, January 1, 2021 | 1151500000 | 3853000000 |
| Saturday, January 1, 2022 | 1471600000 | 4996000000 |
| Sunday, January 1, 2023 | 1888100000 | 5813000000 |
| Monday, January 1, 2024 | 1904100000 | 6150000000 |
Unlocking the unknown
In the competitive landscape of industrial equipment and electrical products, United Rentals, Inc. and Hubbell Incorporated stand as titans. Over the past decade, United Rentals has consistently outperformed Hubbell in terms of gross profit. From 2014 to 2023, United Rentals saw a remarkable growth of approximately 139%, peaking at an impressive $5.8 billion in 2023. In contrast, Hubbell's gross profit increased by about 70% during the same period, reaching $1.9 billion in 2023.
This trend highlights United Rentals' strategic prowess in capitalizing on market opportunities, while Hubbell's steady growth reflects its resilience in a competitive market. Notably, the data for 2024 is incomplete, with Hubbell's figures missing, leaving room for speculation on future performance. As these industry leaders continue to evolve, their financial trajectories offer valuable insights into the dynamics of the industrial sector.
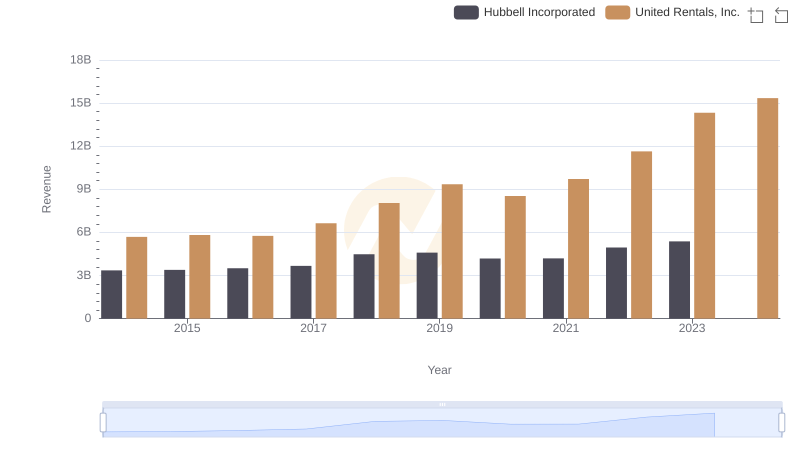
Revenue Showdown: United Rentals, Inc. vs Hubbell Incorporated
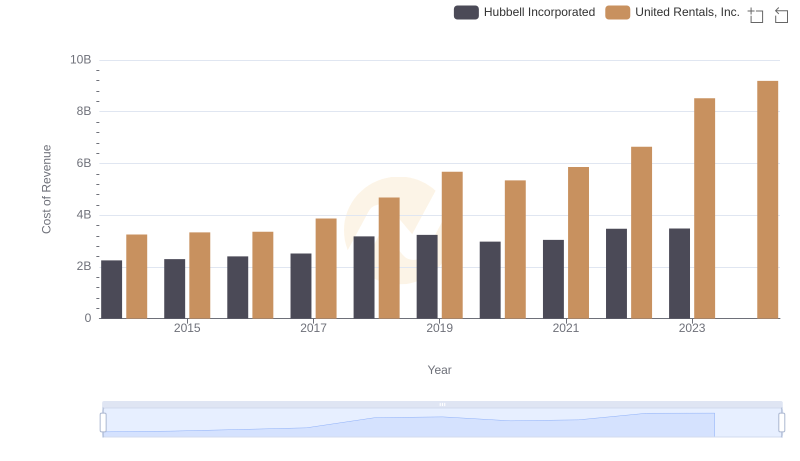
Comparing Cost of Revenue Efficiency: United Rentals, Inc. vs Hubbell Incorporated
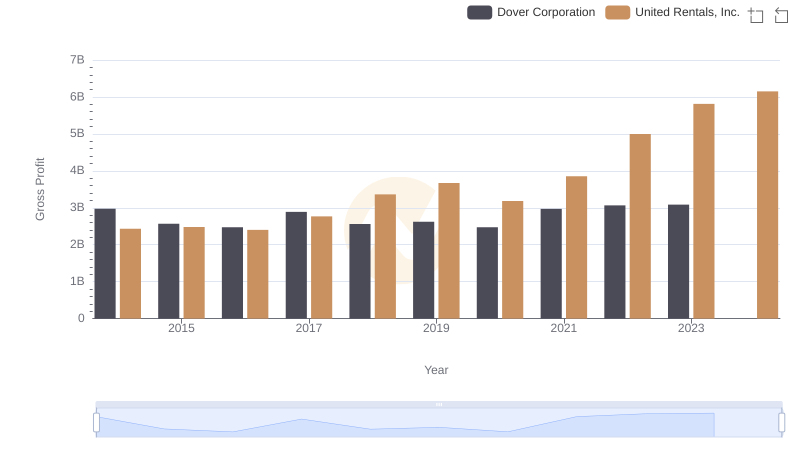
Gross Profit Trends Compared: United Rentals, Inc. vs Dover Corporation
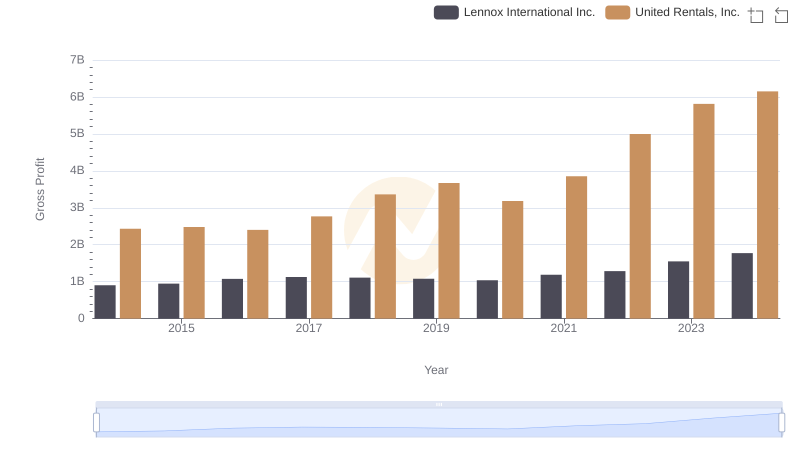
Gross Profit Comparison: United Rentals, Inc. and Lennox International Inc. Trends
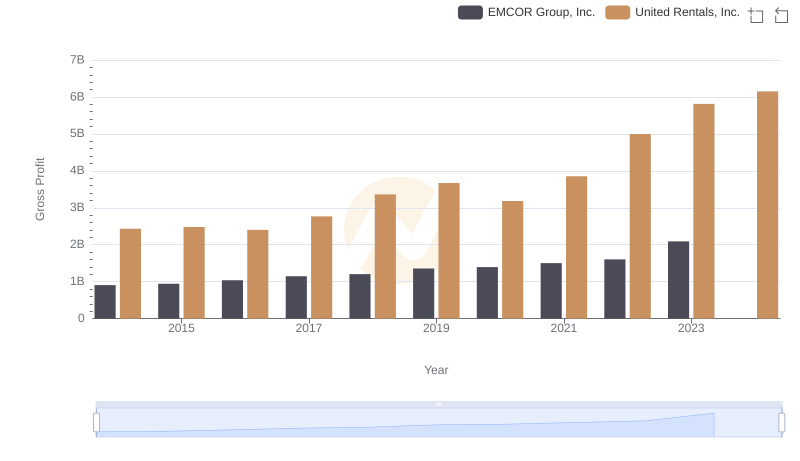
United Rentals, Inc. and EMCOR Group, Inc.: A Detailed Gross Profit Analysis
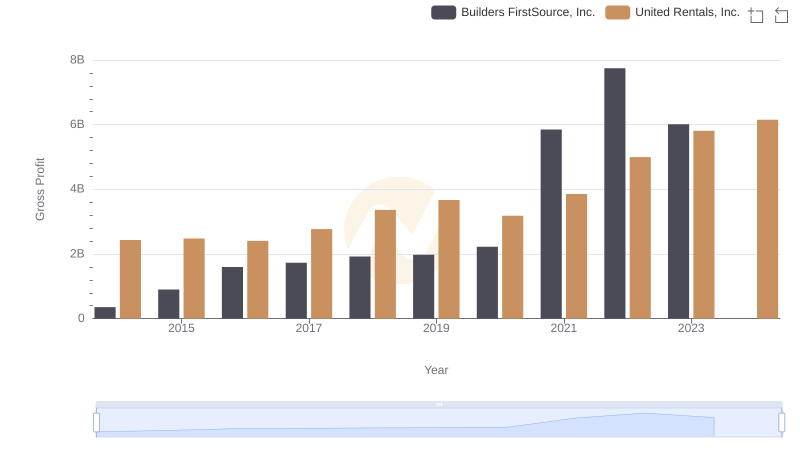
Gross Profit Comparison: United Rentals, Inc. and Builders FirstSource, Inc. Trends
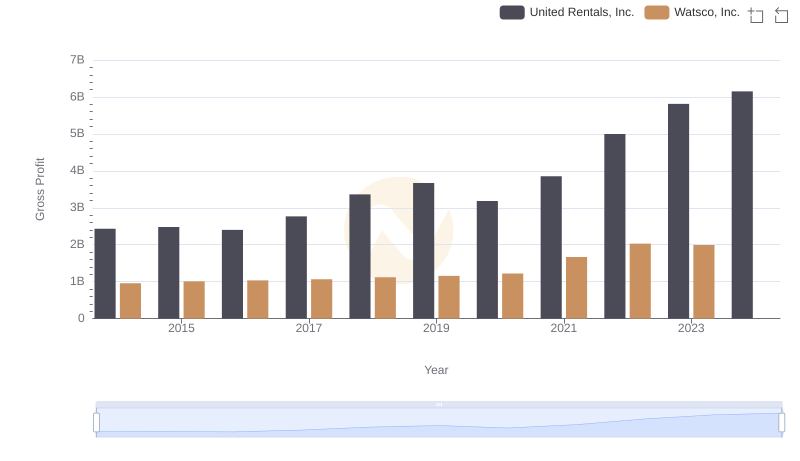
Gross Profit Analysis: Comparing United Rentals, Inc. and Watsco, Inc.
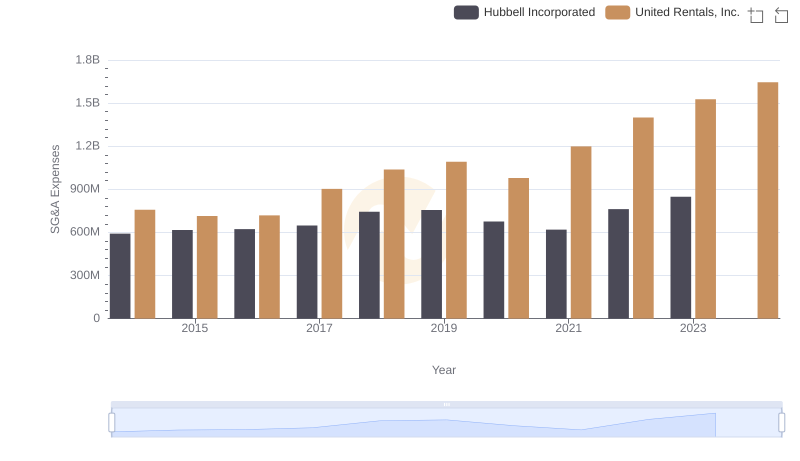
Who Optimizes SG&A Costs Better? United Rentals, Inc. or Hubbell Incorporated
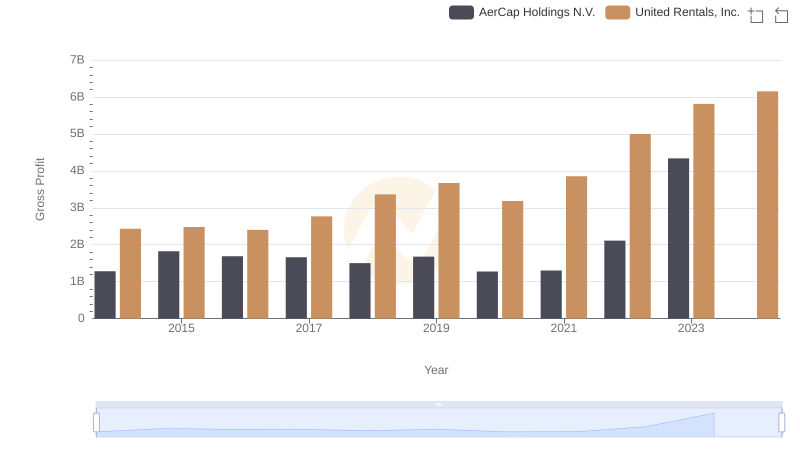
Gross Profit Analysis: Comparing United Rentals, Inc. and AerCap Holdings N.V.
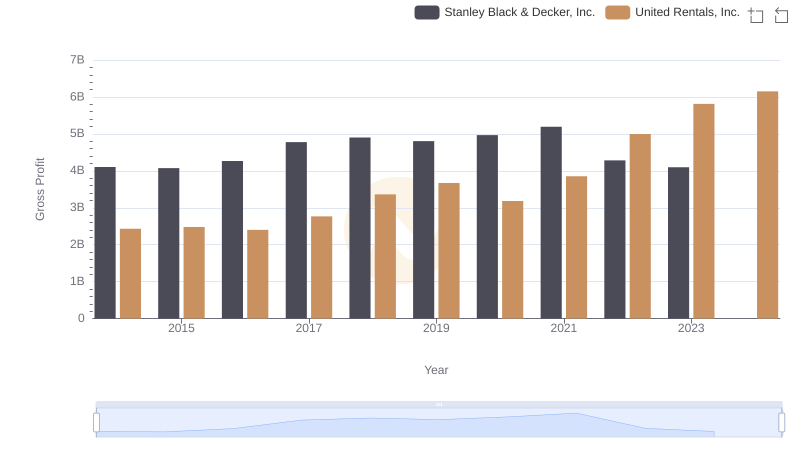
Gross Profit Analysis: Comparing United Rentals, Inc. and Stanley Black & Decker, Inc.
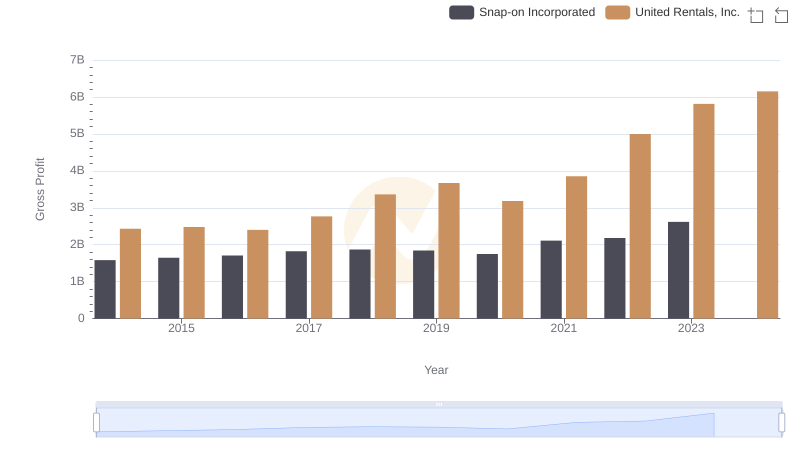
Gross Profit Analysis: Comparing United Rentals, Inc. and Snap-on Incorporated
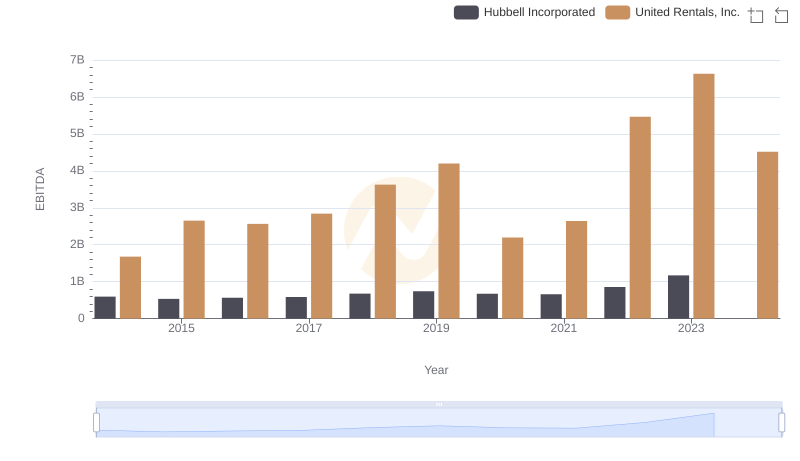
EBITDA Analysis: Evaluating United Rentals, Inc. Against Hubbell Incorporated