| __timestamp | HEICO Corporation | United Rentals, Inc. |
|---|---|---|
| Wednesday, January 1, 2014 | 251213000 | 1678000000 |
| Thursday, January 1, 2015 | 276790000 | 2653000000 |
| Friday, January 1, 2016 | 325022000 | 2566000000 |
| Sunday, January 1, 2017 | 372581000 | 2843000000 |
| Monday, January 1, 2018 | 452287000 | 3628000000 |
| Tuesday, January 1, 2019 | 542136000 | 4200000000 |
| Wednesday, January 1, 2020 | 465714000 | 2195000000 |
| Friday, January 1, 2021 | 486243000 | 2642000000 |
| Saturday, January 1, 2022 | 592709000 | 5464000000 |
| Sunday, January 1, 2023 | 756767000 | 6627000000 |
| Monday, January 1, 2024 | 824455000 | 4516000000 |
Unveiling the hidden dimensions of data
In the ever-evolving landscape of industrial services and aerospace technology, United Rentals, Inc. and HEICO Corporation stand as formidable players. Over the past decade, from 2014 to 2023, these companies have showcased distinct trajectories in their EBITDA performance. United Rentals, Inc. has consistently outpaced HEICO Corporation, with its EBITDA peaking at a staggering 6.6 billion in 2023, marking a growth of nearly 295% from its 2014 figures. In contrast, HEICO Corporation, while more modest in scale, has demonstrated a steady upward trend, achieving a 228% increase over the same period, culminating in an EBITDA of approximately 825 million in 2024. This comparison not only highlights the robust expansion of United Rentals, Inc. but also underscores HEICO Corporation's resilience and steady growth in a competitive market. As we look to the future, these trends offer valuable insights into the strategic directions and market dynamics of these industry leaders.
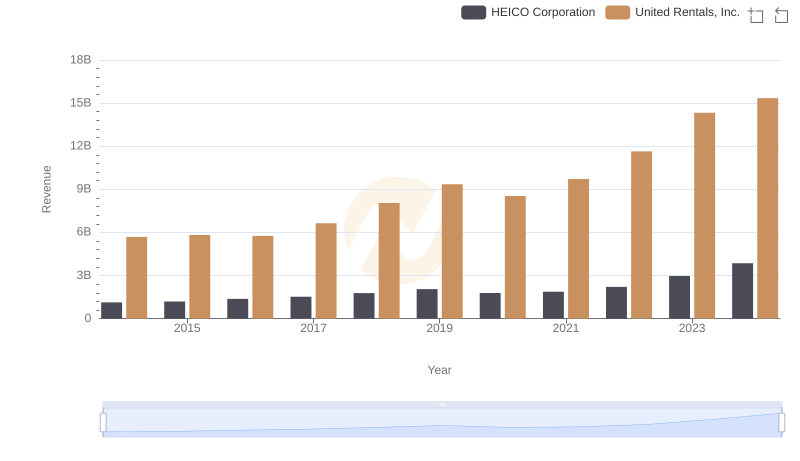
Who Generates More Revenue? United Rentals, Inc. or HEICO Corporation
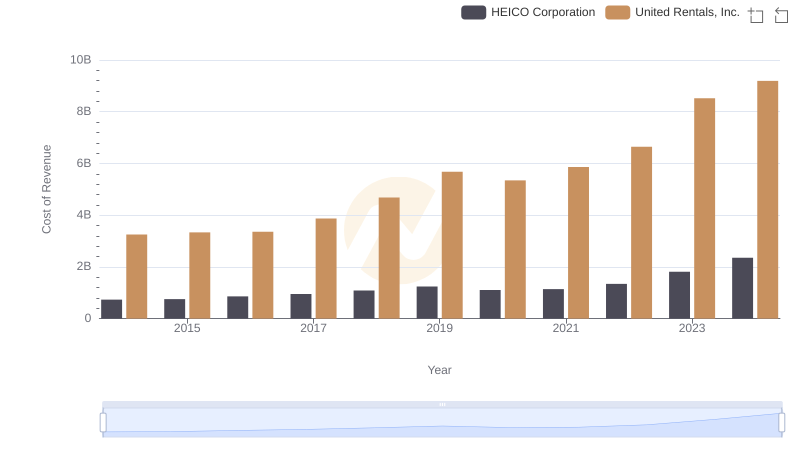
United Rentals, Inc. vs HEICO Corporation: Efficiency in Cost of Revenue Explored
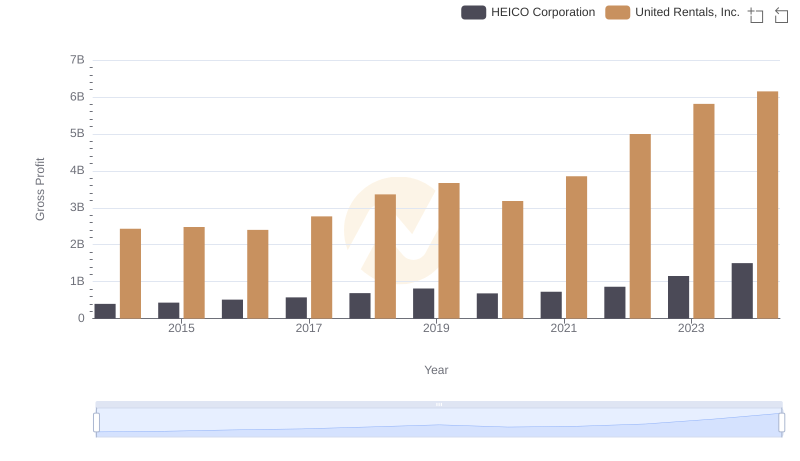
Who Generates Higher Gross Profit? United Rentals, Inc. or HEICO Corporation
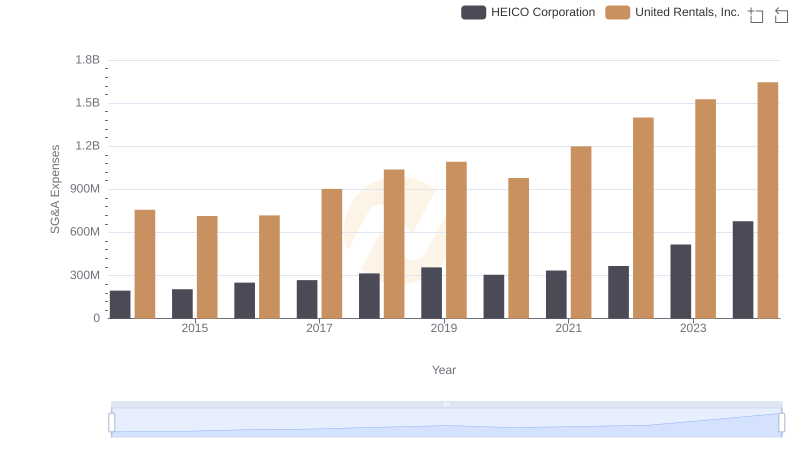
United Rentals, Inc. vs HEICO Corporation: SG&A Expense Trends
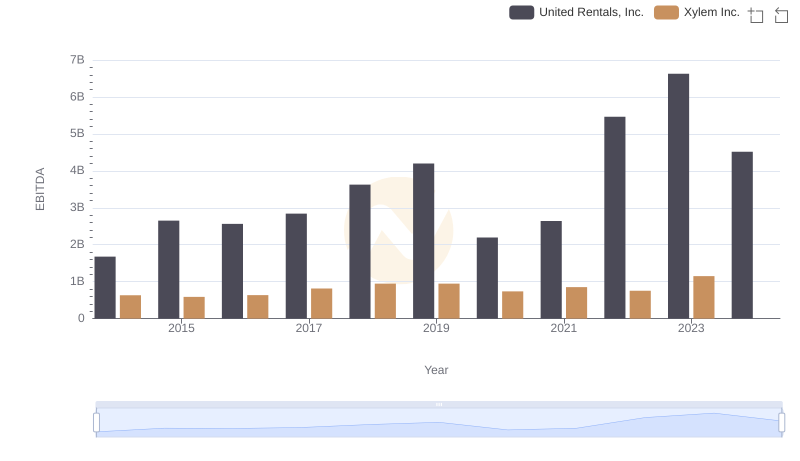
A Side-by-Side Analysis of EBITDA: United Rentals, Inc. and Xylem Inc.
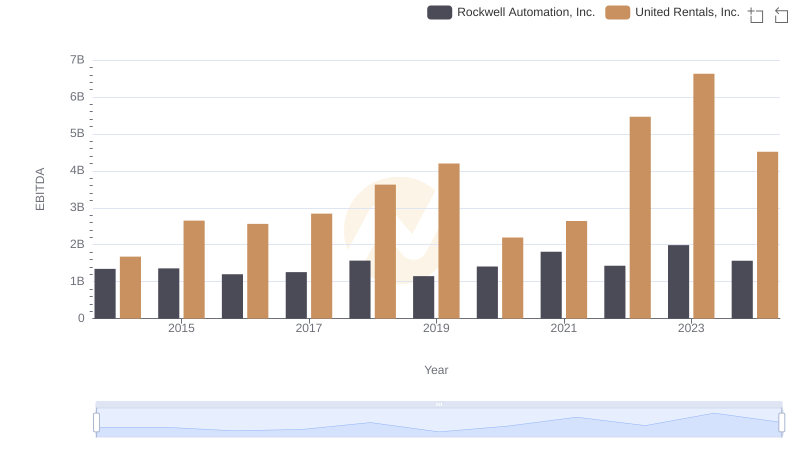
EBITDA Metrics Evaluated: United Rentals, Inc. vs Rockwell Automation, Inc.
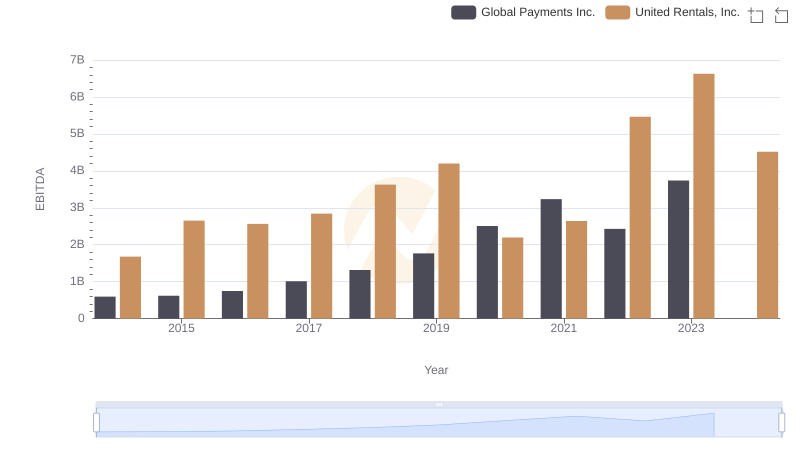
A Side-by-Side Analysis of EBITDA: United Rentals, Inc. and Global Payments Inc.
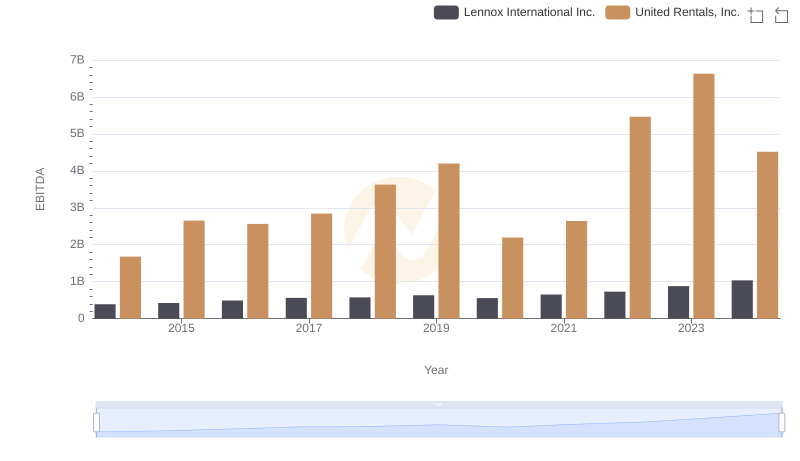
EBITDA Performance Review: United Rentals, Inc. vs Lennox International Inc.
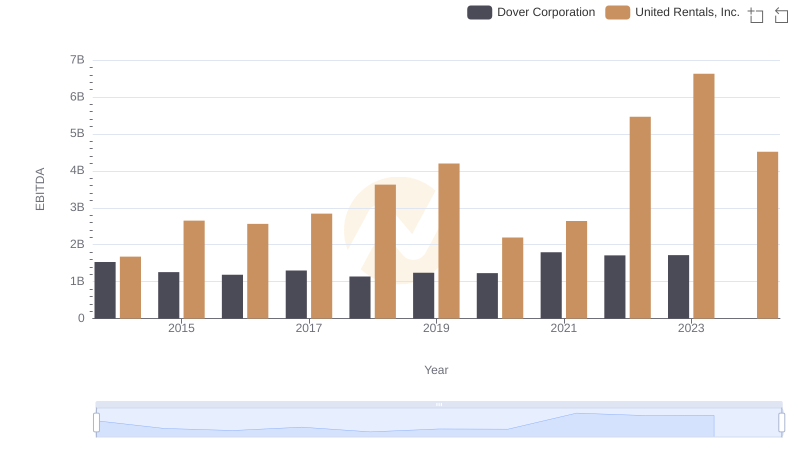
Comparative EBITDA Analysis: United Rentals, Inc. vs Dover Corporation
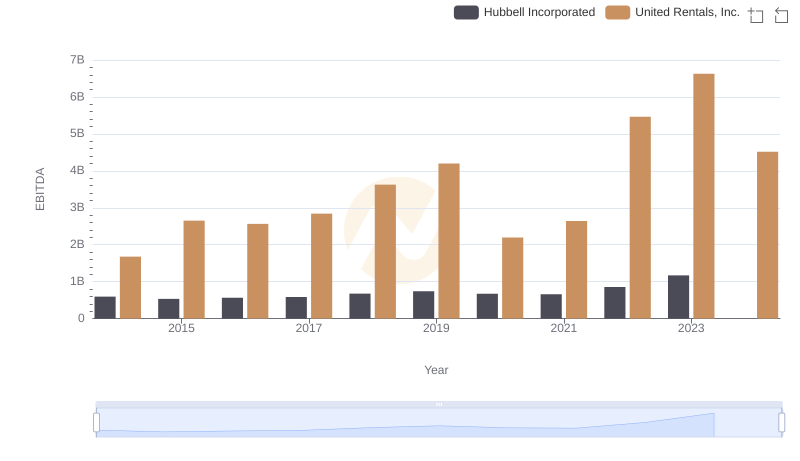
EBITDA Analysis: Evaluating United Rentals, Inc. Against Hubbell Incorporated

Comprehensive EBITDA Comparison: United Rentals, Inc. vs EMCOR Group, Inc.
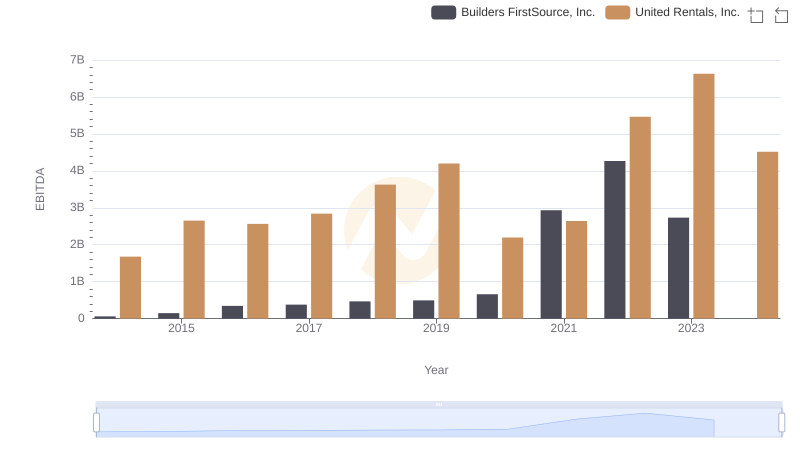
United Rentals, Inc. vs Builders FirstSource, Inc.: In-Depth EBITDA Performance Comparison