| __timestamp | Dover Corporation | United Rentals, Inc. |
|---|---|---|
| Wednesday, January 1, 2014 | 1533084000 | 1678000000 |
| Thursday, January 1, 2015 | 1259375000 | 2653000000 |
| Friday, January 1, 2016 | 1186472000 | 2566000000 |
| Sunday, January 1, 2017 | 1304041000 | 2843000000 |
| Monday, January 1, 2018 | 1138930000 | 3628000000 |
| Tuesday, January 1, 2019 | 1241114000 | 4200000000 |
| Wednesday, January 1, 2020 | 1232722000 | 2195000000 |
| Friday, January 1, 2021 | 1797268000 | 2642000000 |
| Saturday, January 1, 2022 | 1711499000 | 5464000000 |
| Sunday, January 1, 2023 | 1718774000 | 6627000000 |
| Monday, January 1, 2024 | 1206355000 | 4516000000 |
Unveiling the hidden dimensions of data
In the ever-evolving landscape of industrial services, United Rentals, Inc. and Dover Corporation have emerged as key players. Over the past decade, United Rentals has consistently outperformed Dover Corporation in terms of EBITDA, showcasing a robust growth trajectory. From 2014 to 2023, United Rentals' EBITDA surged by approximately 295%, peaking in 2023, while Dover Corporation experienced a more modest increase of around 12% during the same period.
United Rentals' strategic acquisitions and expansion into new markets have fueled its impressive growth, particularly evident in the 2022-2023 period, where EBITDA jumped by nearly 21%. In contrast, Dover Corporation's EBITDA growth has been steadier, reflecting its focus on operational efficiency and innovation.
As we look to the future, the missing data for 2024 suggests potential volatility, but the trends indicate that United Rentals is well-positioned to maintain its lead.

United Rentals, Inc. or Dover Corporation: Who Leads in Yearly Revenue?
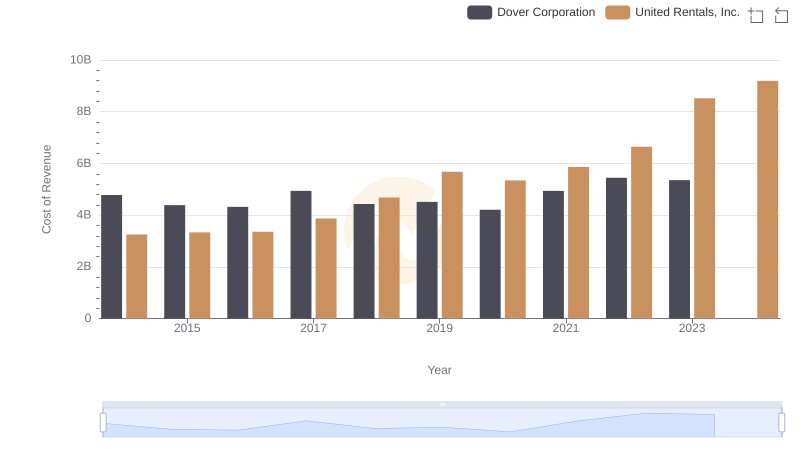
Cost Insights: Breaking Down United Rentals, Inc. and Dover Corporation's Expenses
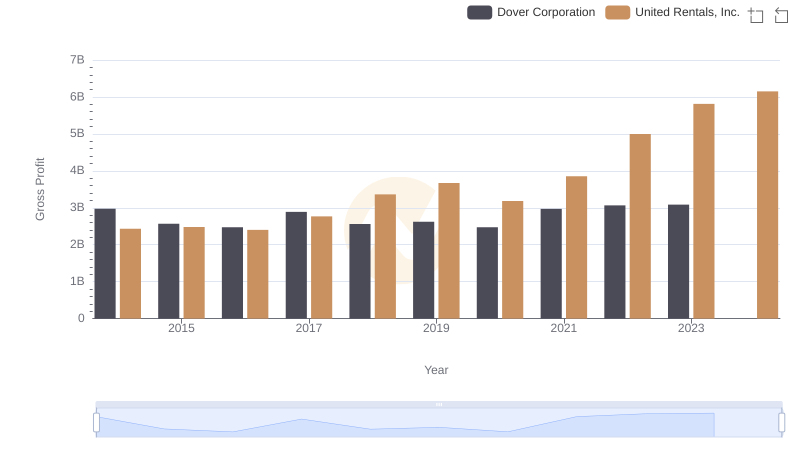
Gross Profit Trends Compared: United Rentals, Inc. vs Dover Corporation
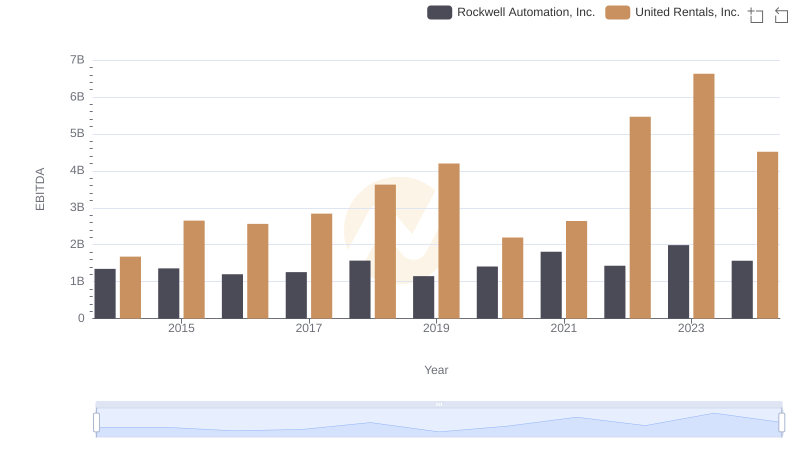
EBITDA Metrics Evaluated: United Rentals, Inc. vs Rockwell Automation, Inc.
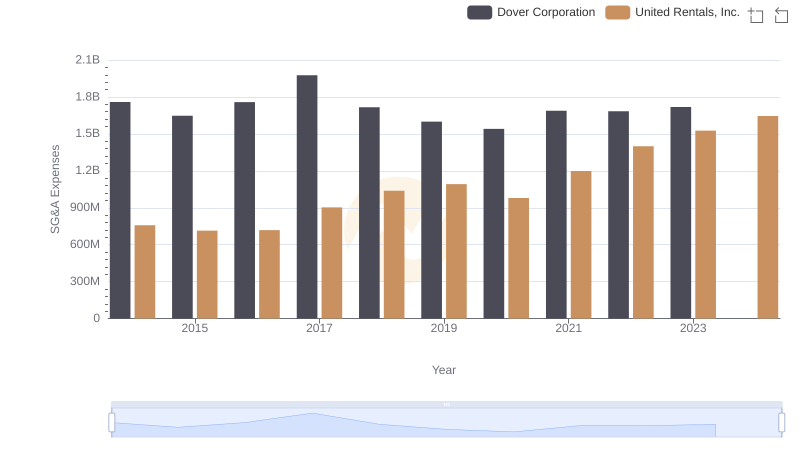
Operational Costs Compared: SG&A Analysis of United Rentals, Inc. and Dover Corporation
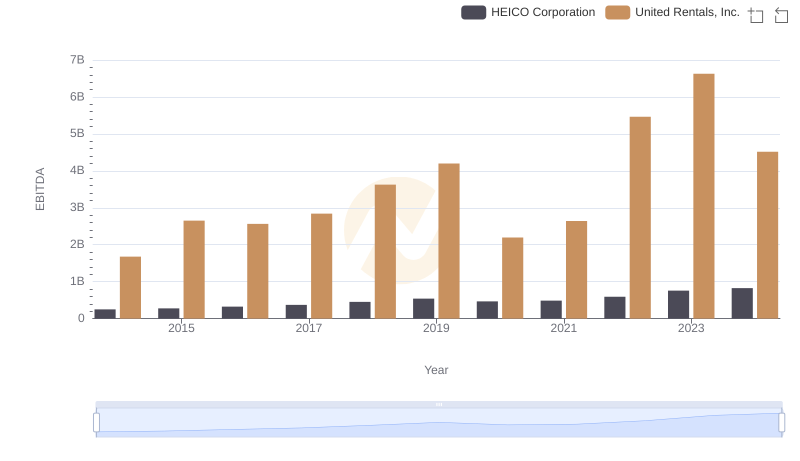
United Rentals, Inc. vs HEICO Corporation: In-Depth EBITDA Performance Comparison
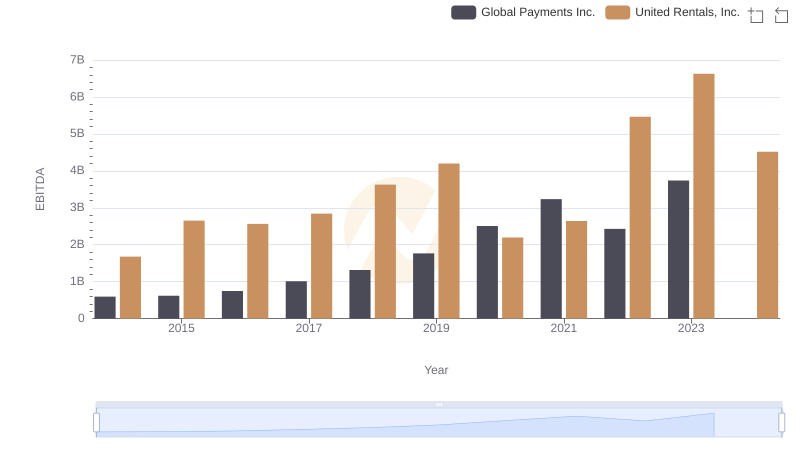
A Side-by-Side Analysis of EBITDA: United Rentals, Inc. and Global Payments Inc.
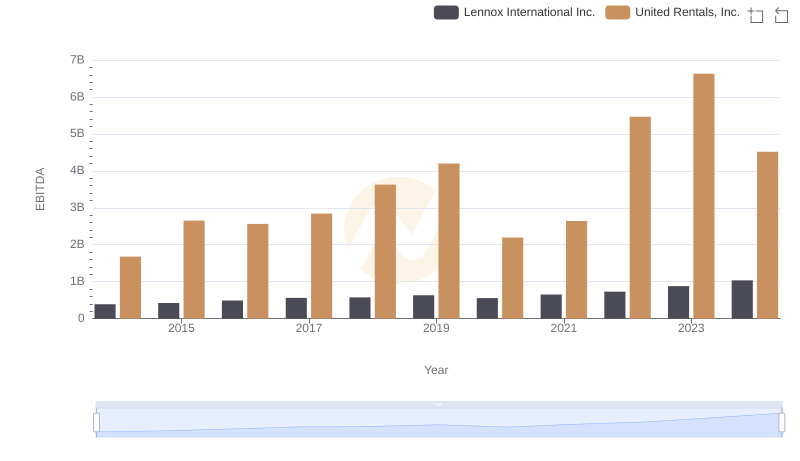
EBITDA Performance Review: United Rentals, Inc. vs Lennox International Inc.
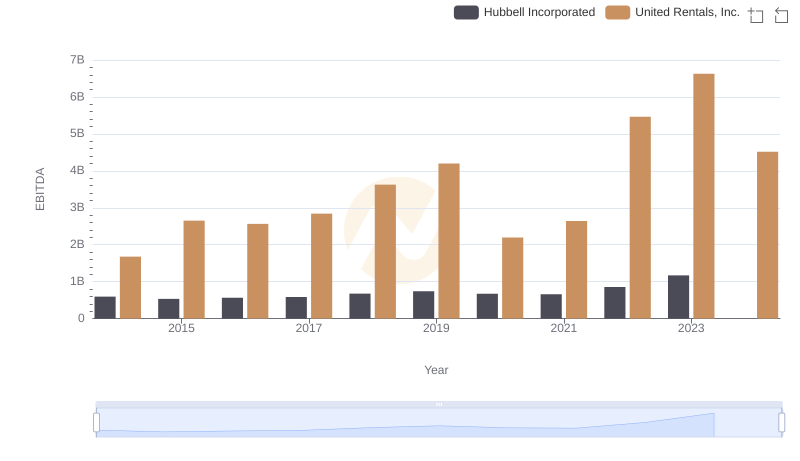
EBITDA Analysis: Evaluating United Rentals, Inc. Against Hubbell Incorporated

Comprehensive EBITDA Comparison: United Rentals, Inc. vs EMCOR Group, Inc.
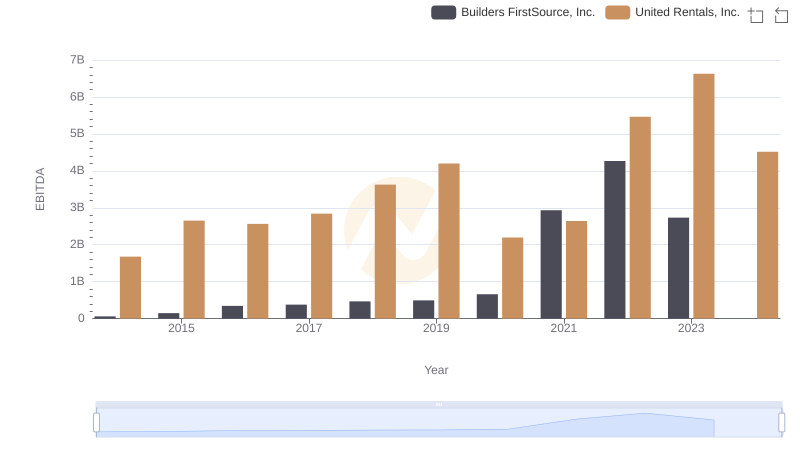
United Rentals, Inc. vs Builders FirstSource, Inc.: In-Depth EBITDA Performance Comparison
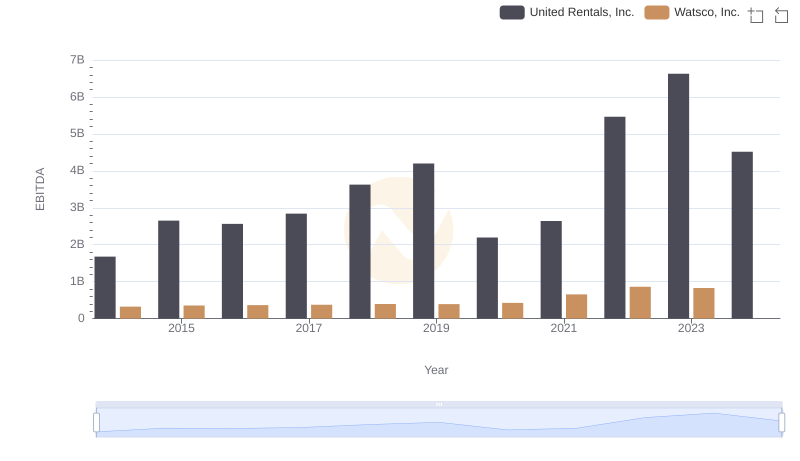
EBITDA Analysis: Evaluating United Rentals, Inc. Against Watsco, Inc.