| __timestamp | Global Payments Inc. | United Rentals, Inc. |
|---|---|---|
| Wednesday, January 1, 2014 | 594102000 | 1678000000 |
| Thursday, January 1, 2015 | 618109000 | 2653000000 |
| Friday, January 1, 2016 | 748136000 | 2566000000 |
| Sunday, January 1, 2017 | 1010019000 | 2843000000 |
| Monday, January 1, 2018 | 1315968000 | 3628000000 |
| Tuesday, January 1, 2019 | 1764994000 | 4200000000 |
| Wednesday, January 1, 2020 | 2508393000 | 2195000000 |
| Friday, January 1, 2021 | 3233589000 | 2642000000 |
| Saturday, January 1, 2022 | 2427684000 | 5464000000 |
| Sunday, January 1, 2023 | 3606789000 | 6627000000 |
| Monday, January 1, 2024 | 2333605000 | 4516000000 |
Unleashing the power of data
In the ever-evolving landscape of corporate finance, EBITDA serves as a crucial indicator of a company's operational performance. Over the past decade, United Rentals, Inc. and Global Payments Inc. have showcased contrasting trajectories in their EBITDA growth. From 2014 to 2023, United Rentals has consistently outperformed, with a staggering 295% increase, peaking at $6.63 billion in 2023. Meanwhile, Global Payments has demonstrated a robust 530% growth, reaching $3.74 billion in the same year.
The year 2020 marked a pivotal point, with Global Payments surpassing the $2 billion mark, while United Rentals experienced a temporary dip. However, by 2022, United Rentals rebounded, achieving a 107% increase from 2020. As we look to the future, the 2024 data for Global Payments remains elusive, leaving room for speculation on its continued growth trajectory.
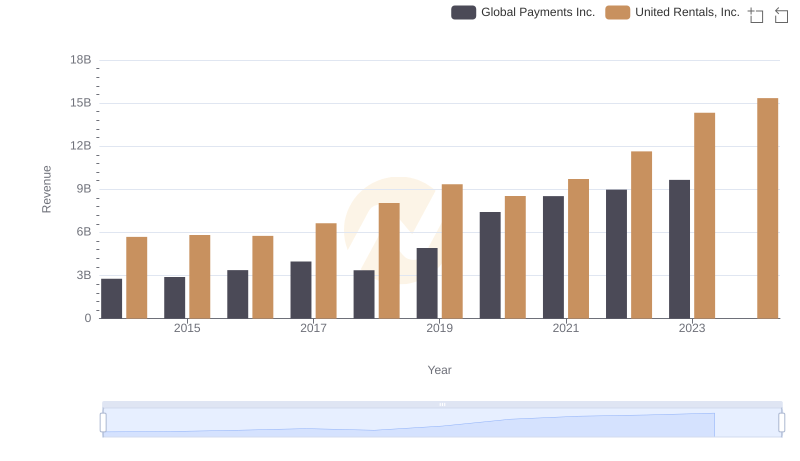
Comparing Revenue Performance: United Rentals, Inc. or Global Payments Inc.?
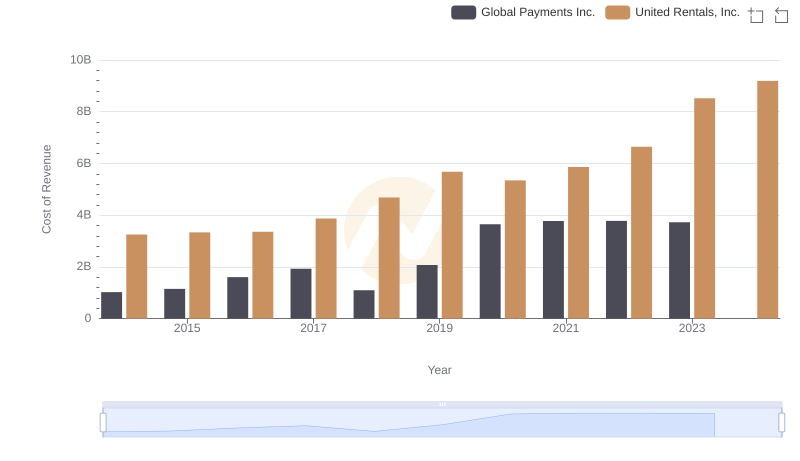
United Rentals, Inc. vs Global Payments Inc.: Efficiency in Cost of Revenue Explored
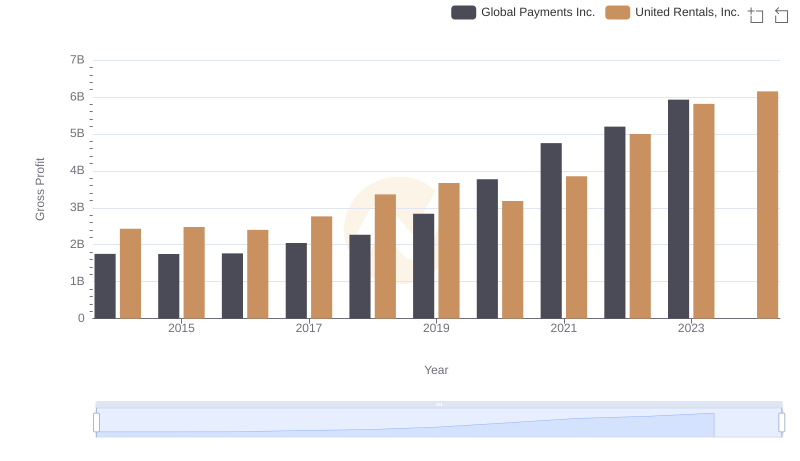
United Rentals, Inc. vs Global Payments Inc.: A Gross Profit Performance Breakdown
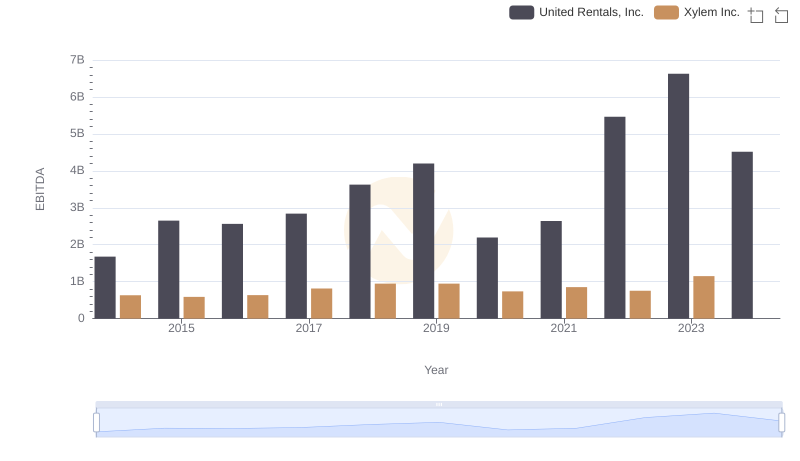
A Side-by-Side Analysis of EBITDA: United Rentals, Inc. and Xylem Inc.
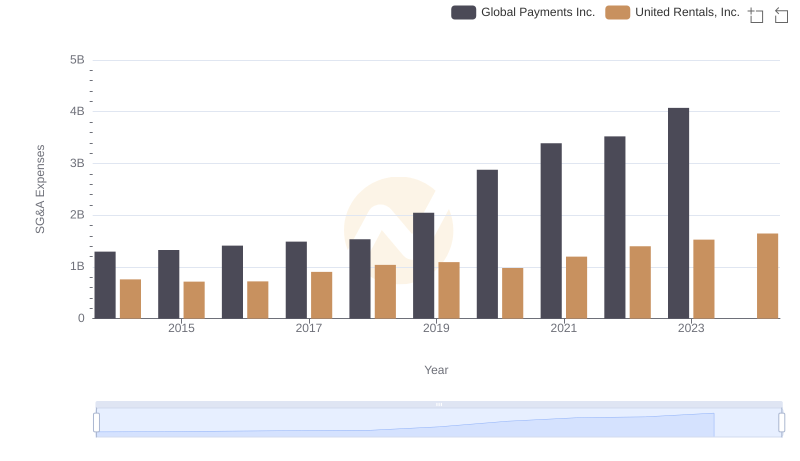
United Rentals, Inc. and Global Payments Inc.: SG&A Spending Patterns Compared
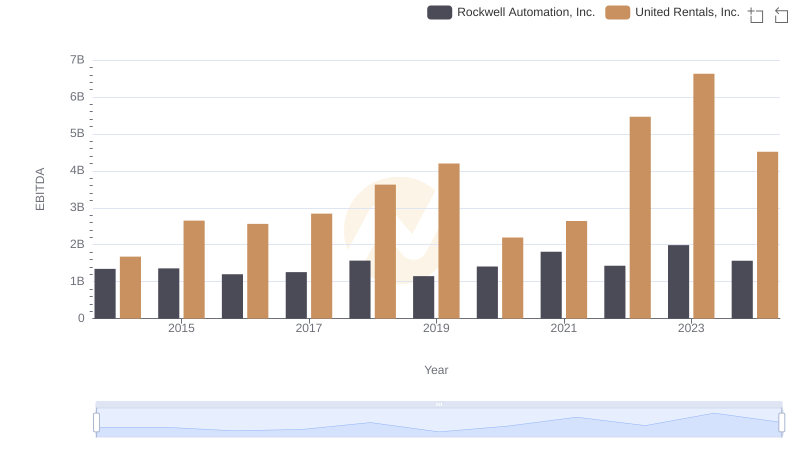
EBITDA Metrics Evaluated: United Rentals, Inc. vs Rockwell Automation, Inc.
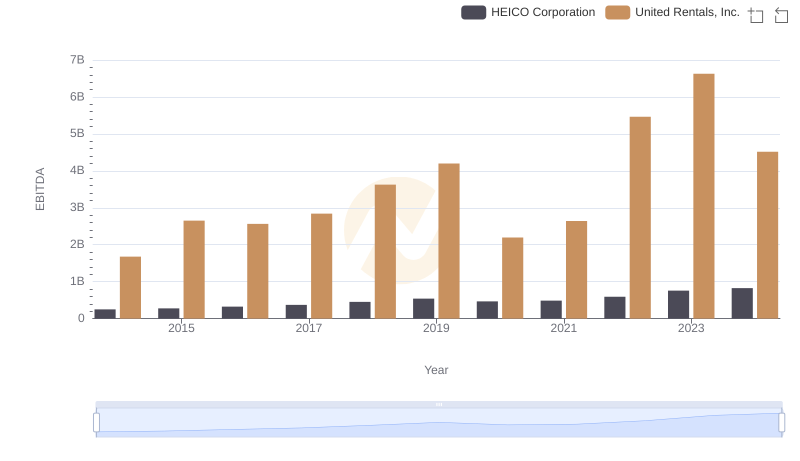
United Rentals, Inc. vs HEICO Corporation: In-Depth EBITDA Performance Comparison
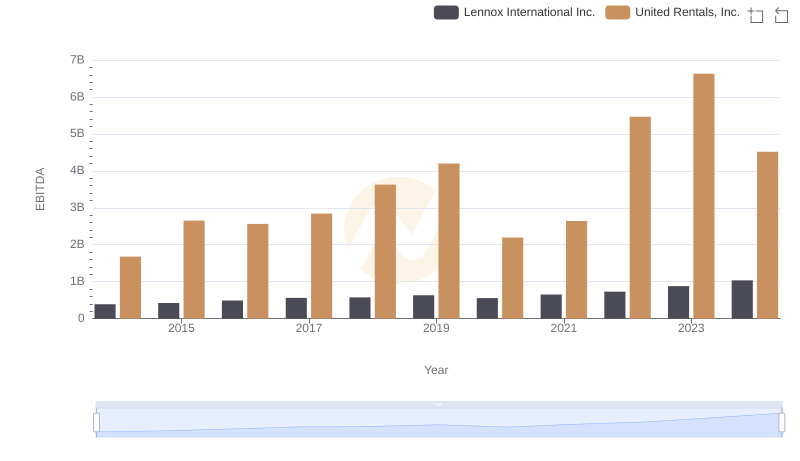
EBITDA Performance Review: United Rentals, Inc. vs Lennox International Inc.
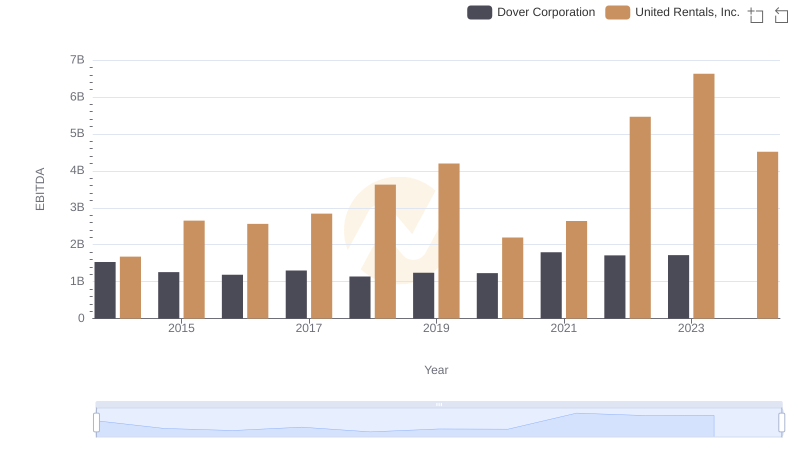
Comparative EBITDA Analysis: United Rentals, Inc. vs Dover Corporation
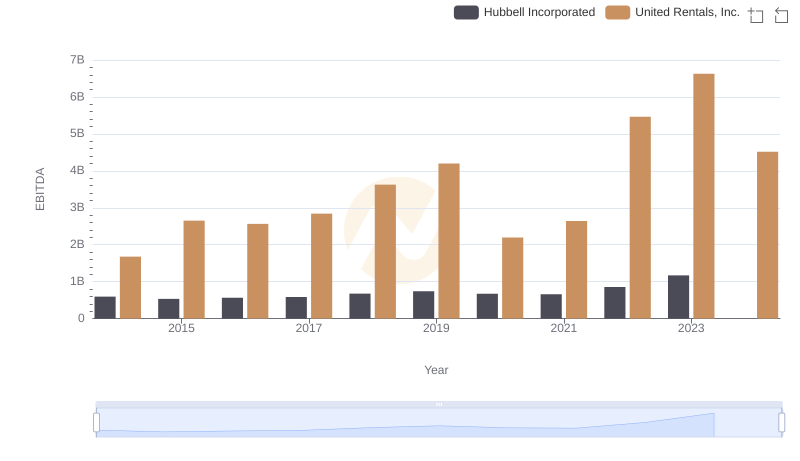
EBITDA Analysis: Evaluating United Rentals, Inc. Against Hubbell Incorporated

Comprehensive EBITDA Comparison: United Rentals, Inc. vs EMCOR Group, Inc.
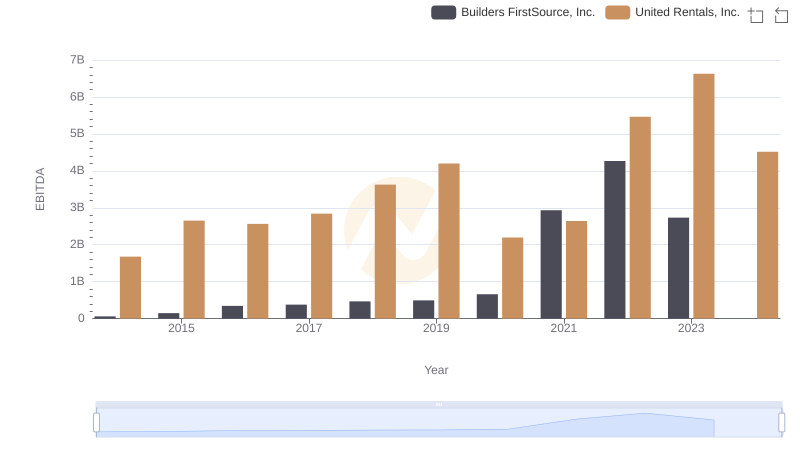
United Rentals, Inc. vs Builders FirstSource, Inc.: In-Depth EBITDA Performance Comparison