| __timestamp | EMCOR Group, Inc. | United Rentals, Inc. |
|---|---|---|
| Wednesday, January 1, 2014 | 355858000 | 1678000000 |
| Thursday, January 1, 2015 | 362095000 | 2653000000 |
| Friday, January 1, 2016 | 395913000 | 2566000000 |
| Sunday, January 1, 2017 | 478459000 | 2843000000 |
| Monday, January 1, 2018 | 489954000 | 3628000000 |
| Tuesday, January 1, 2019 | 556055000 | 4200000000 |
| Wednesday, January 1, 2020 | 601449000 | 2195000000 |
| Friday, January 1, 2021 | 646861000 | 2642000000 |
| Saturday, January 1, 2022 | 682399000 | 5464000000 |
| Sunday, January 1, 2023 | 1009017000 | 6627000000 |
| Monday, January 1, 2024 | 4516000000 |
Unlocking the unknown
In the competitive landscape of industrial services, United Rentals, Inc. and EMCOR Group, Inc. have showcased remarkable EBITDA growth over the past decade. Since 2014, United Rentals has consistently outperformed EMCOR, with its EBITDA growing by approximately 295% by 2023. This growth trajectory highlights United Rentals' strategic expansions and operational efficiencies. In contrast, EMCOR Group, while experiencing a steady increase, saw its EBITDA rise by about 184% over the same period. Notably, 2023 marked a significant year for both companies, with United Rentals achieving its highest EBITDA, nearly 6.6 times that of EMCOR. However, 2024 data for EMCOR is missing, leaving room for speculation on its future performance. This comparison underscores the dynamic nature of the industrial sector and the varying strategies companies employ to enhance profitability.
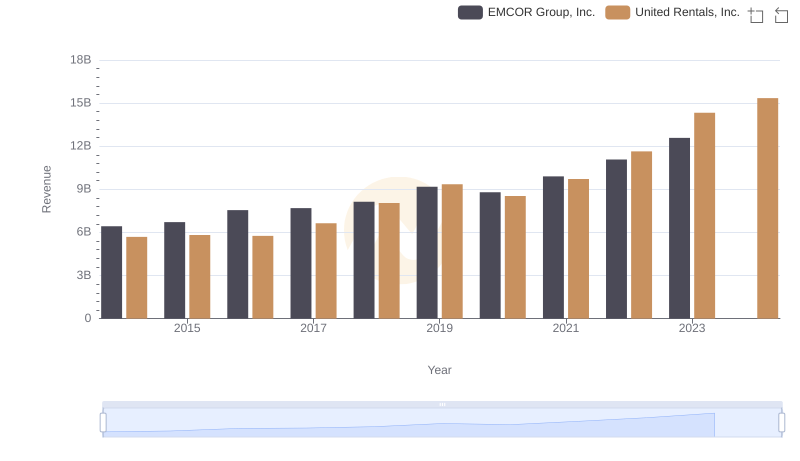
United Rentals, Inc. vs EMCOR Group, Inc.: Examining Key Revenue Metrics
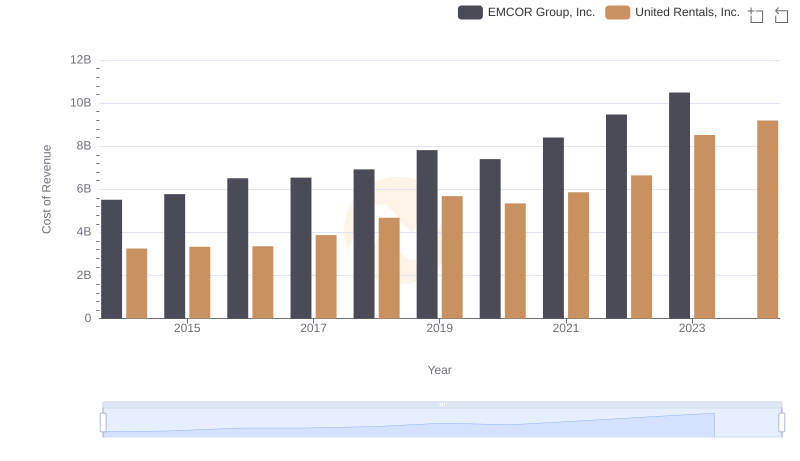
United Rentals, Inc. vs EMCOR Group, Inc.: Efficiency in Cost of Revenue Explored
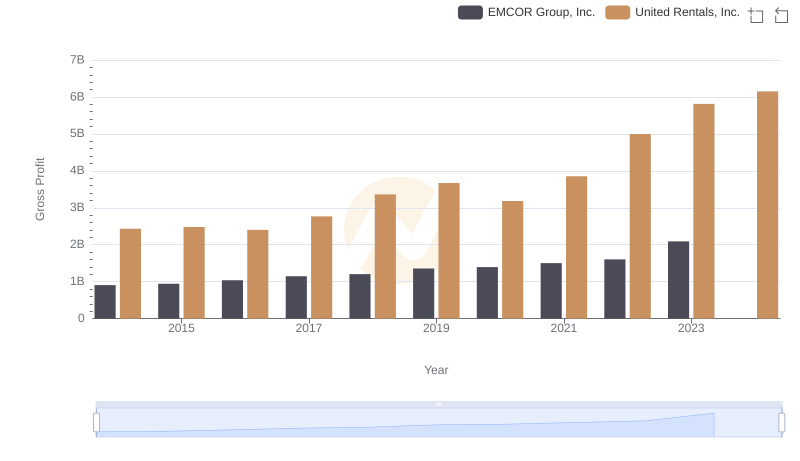
United Rentals, Inc. and EMCOR Group, Inc.: A Detailed Gross Profit Analysis
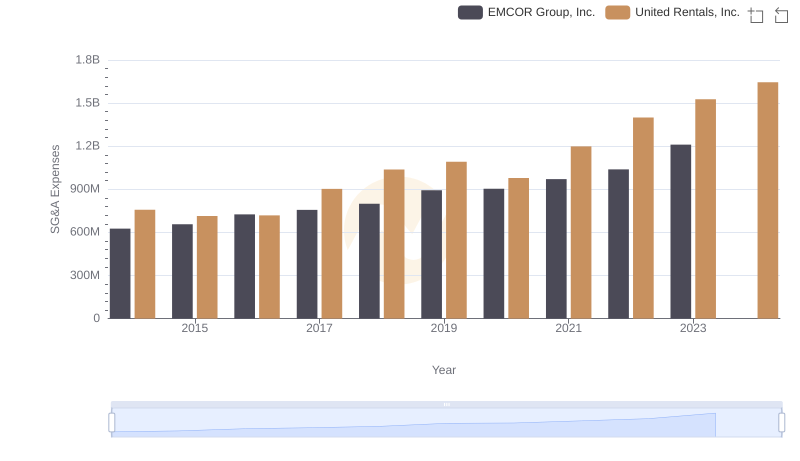
SG&A Efficiency Analysis: Comparing United Rentals, Inc. and EMCOR Group, Inc.
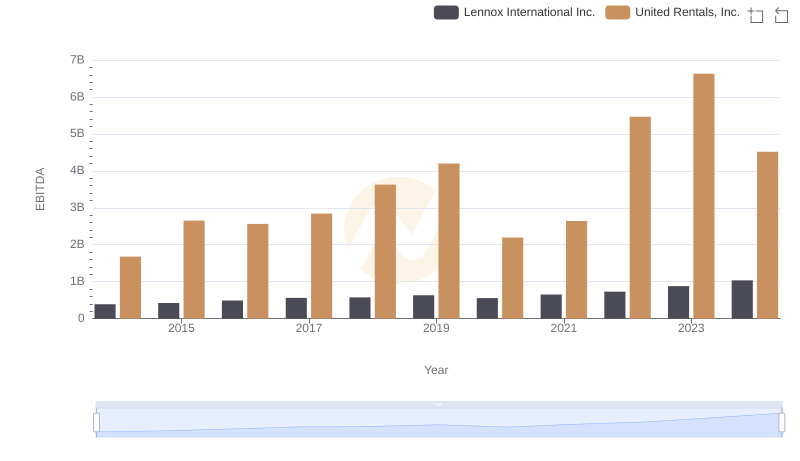
EBITDA Performance Review: United Rentals, Inc. vs Lennox International Inc.
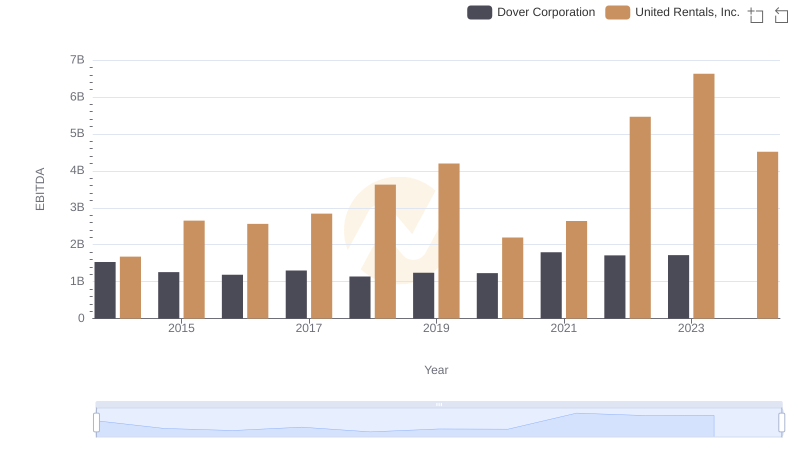
Comparative EBITDA Analysis: United Rentals, Inc. vs Dover Corporation
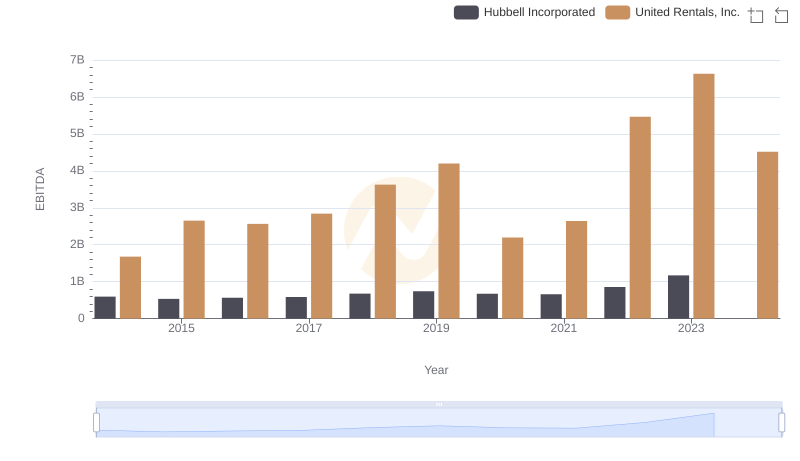
EBITDA Analysis: Evaluating United Rentals, Inc. Against Hubbell Incorporated
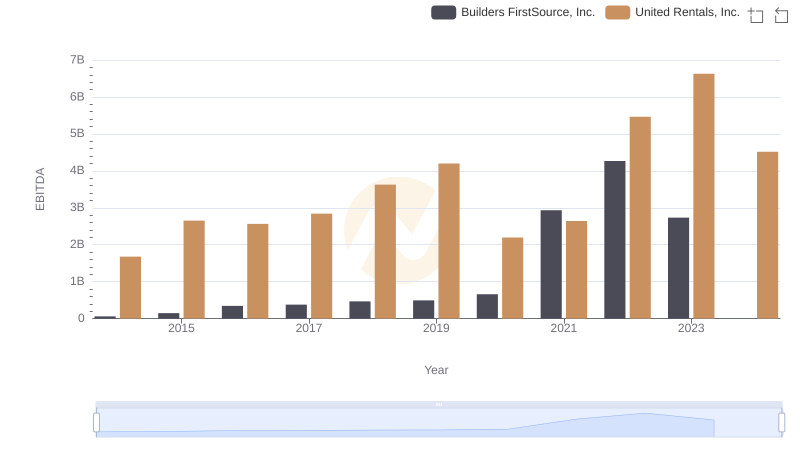
United Rentals, Inc. vs Builders FirstSource, Inc.: In-Depth EBITDA Performance Comparison
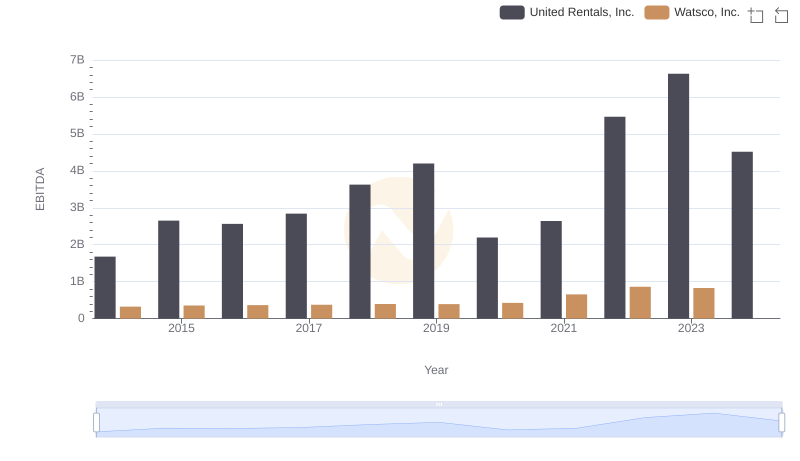
EBITDA Analysis: Evaluating United Rentals, Inc. Against Watsco, Inc.
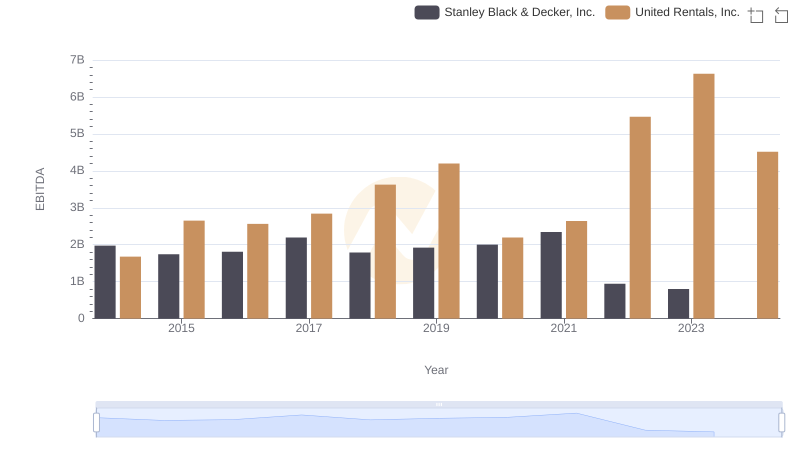
A Side-by-Side Analysis of EBITDA: United Rentals, Inc. and Stanley Black & Decker, Inc.
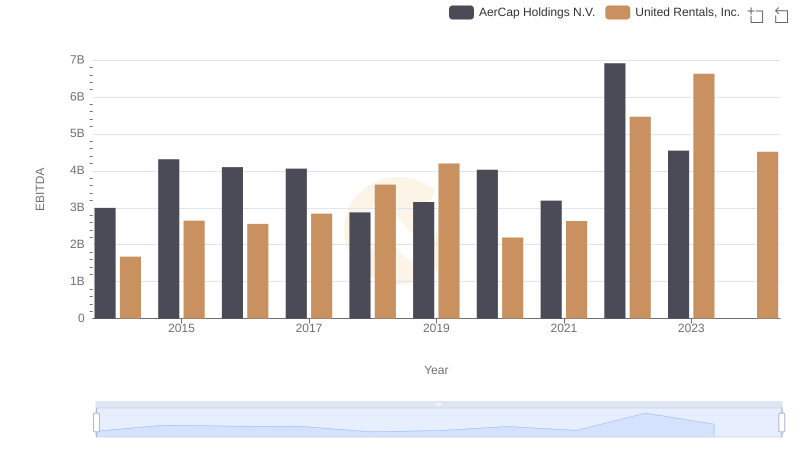
Comparative EBITDA Analysis: United Rentals, Inc. vs AerCap Holdings N.V.
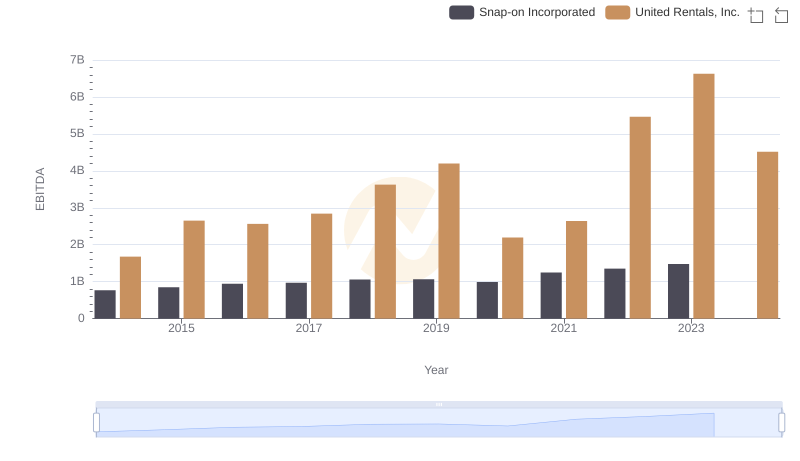
Comparative EBITDA Analysis: United Rentals, Inc. vs Snap-on Incorporated